
UNITED STATES
SECURITIES AND EXCHANGE COMMISSION
Washington, D.C. 20549
Form 10-Q/A
__________________
OF THE SECURITIES EXCHANGE ACT OF 1934
For the quarterly period ended June 30, 2026
OR
OF THE SECURITIES EXCHANGE ACT OF 1934
For the transition period from ______ to _____
Commission file number 1-8974

(Exact name of registrant as specified in its charter)
| (State or other jurisdiction of incorporation or organization) | (I.R.S. Employer Identification No.) | ||||||||||
| (Address of principal executive offices) | (Zip Code) | ||||||||||
| (Registrant’s telephone number, including area code) | |||||||||||
Securities registered pursuant to Section 12(b) of the Act:
| Title of each class | Trading Symbol(s) | Name of each exchange on which registered | ||||||||||||
Indicate by check mark whether the Registrant (1) has filed all reports required to be filed by Section 13 or 15(d) of the Securities Exchange Act of 1934 during the preceding 12 months (or for such shorter period that the Registrant was required to file such reports), and (2) has been subject to such filing requirements for the past 90 days. Yes x No ☐
Indicate by check mark whether the Registrant has submitted electronically every Interactive Data File required to be submitted pursuant to Rule 405 of Regulation S-T (§232.405 of this chapter) during the preceding 12 months (or for such shorter period that the Registrant was required to submit such files). Yes x No ☐
Indicate by check mark whether the Registrant is a large accelerated filer, an accelerated filer, a non-accelerated filer, a smaller reporting company, or an emerging growth company. See definitions of “large accelerated filer,” “accelerated filer,” “smaller reporting company,” and “emerging growth company” in Rule 12b-2 of the Exchange Act.
x | Accelerated filer | ☐ | |||||||||
| Non-accelerated filer | ☐ | Smaller reporting company | |||||||||
| Emerging growth company | |||||||||||
If an emerging growth company, indicate by check mark if the Registrant has elected not to use the extended transition period for complying with any new or revised financial accounting standards provided pursuant to Section 13(a) of the Exchange Act. ☐
Indicate by check mark whether the Registrant is a shell company (as defined in Rule 12b-2 of the Exchange Act). Yes ☐ No x
There were 316,940,010 shares of Common Stock outstanding at June 30, 2026.
EXPLANATORY NOTE
Honeywell International Inc. (we, us, our, Honeywell Technologies, or the Company) is filing this Amendment No. 1 (this Amendment) to its Quarterly Report on Form 10-Q for the quarter ended June 30, 2026, previously filed with the Securities and Exchange Commission (SEC) on July 23, 2026 (the Original Filing), solely for the purpose of correcting typographical errors in the presentation of backlog by business segment in Item 2 of Part I, the Management’s Discussion and Analysis of Financial Condition and Results of Operations (MD&A). Specifically, the backlog amounts reflected for each of the Industrial Automation, Building Automation and Process Automation and Technology segments were misaligned with the amounts corresponding to such segment. The backlog amounts for the Aerospace Technologies segment and the Company were properly aligned with the corresponding segment and remain unchanged. The revised MD&A disclosure is included in Item 2 of Part I of this Amendment.
Except as described above, this Amendment does not amend, update or change any other items or disclosures contained in the Original Filing. This Amendment does not reflect or purport to reflect any information or events occurring after the date of the Original Filing nor does it modify or update the disclosures contained in the Original Filing that may be affected by subsequent events. Accordingly, this Amendment should be read in conjunction with the Original Filing and the Company’s other filings made with the SEC subsequent to the filing of the Original Filing.
ITEM 2. MANAGEMENT’S DISCUSSION AND ANALYSIS OF FINANCIAL CONDITION AND RESULTS OF OPERATIONS
(Dollars in tables and graphs in millions, except per share amounts)
The following Management’s Discussion and Analysis of Financial Condition and Results of Operations is intended to help the reader understand the results of operations and financial condition of Honeywell International Inc. and its consolidated subsidiaries (Honeywell Technologies, we, us, our, or the Company) for the three and six months ended June 30, 2026. The financial information as of June 30, 2026, should be read in conjunction with the Consolidated Financial Statements for the year ended December 31, 2025, contained in our 2025 Annual Report on Form 10-K. Certain prior year amounts are reclassified to conform to the current year presentation. Discussions throughout the Management’s Discussion and Analysis of Financial Condition and Results of Operations are based on continuing operations unless otherwise noted.
BUSINESS UPDATE
MACROECONOMIC CONDITIONS
We continue to operate in a challenging macroeconomic and geopolitical environment, including ongoing conflict in the Middle East and its impact on energy markets, trade flows, and shipping. Global growth expectations moderated, while inflationary pressures and market volatility remain elevated. In response, we remain focused on disciplined supplier engagement and proactive actions to manage critical material availability, logistics conditions, and input cost volatility across our network.
Mitigation strategies are an important component of our approach to managing these risks, including portfolio and supply chain simplification, alignment to local and regional supply sources, pricing actions, dual-source strategies, and longer-term approaches for constrained materials. These efforts include direct engagement with key suppliers, new supplier development, and, where appropriate, design modifications. We maintain relationships with both primary and secondary suppliers to support sourcing continuity and operational flexibility. Due to stringent quality controls and product qualification processes, these strategies have not impacted, and are not expected to impact, product quality or reliability.
To date, our strategies have helped manage our exposure to these supply chain and cost-related conditions. However, continued volatility driven by geopolitical conflict, evolving trade policies, and persistent inflationary pressures may have a material adverse effect on our consolidated results of operations, cash flows, or financial condition.
PORTFOLIO TRANSFORMATION
We continually assess the relative strength of each business in our portfolio as to strategic fit, market position, profit, and cash flow contribution in order to identify target investment and acquisition opportunities in order to upgrade our combined portfolio. We also identify businesses that do not fit into our long-term strategic plan based on their market position, relative profitability, or growth potential.
In 2025, we announced we were evaluating strategic alternatives for our Productivity Solutions and Services and Warehouse and Workflow Solutions businesses within the Industrial Automation reportable segment to further simplify Honeywell Technologies’ portfolio and accelerate shareowner value creation ahead of the Aerospace Spin-Off. Beginning December 31, 2025, the assets and liabilities of these businesses were classified as held for sale. In April 2026, we announced that we reached agreements to sell the businesses in two separate transactions, both of which are expected to close in the third quarter of 2026 and are subject to customary closing conditions, including receipt of certain regulatory approvals.
On June 4, 2026, the Company’s former consolidated subsidiary Quantinuum completed its IPO. Upon completion of the IPO, the Company retained a 48% noncontrolling ownership interest in Quantinuum and accounts for its Quantinuum investment as an equity method investment.
In the third quarter on June 29, 2026, the Company completed the Aerospace Spin-Off. Each Honeywell Technologies shareowner received one share of Honeywell Aerospace common stock for every two shares of Honeywell Technologies common stock held of record as of the close of business on June 15, 2026, except that they received cash in lieu of any fractional shares of Honeywell Aerospace common stock that they would have received after application of such distribution ratio. After the date of the Aerospace Spin-Off, Honeywell Technologies does not beneficially own any shares of Honeywell Aerospace common stock and no longer consolidates Honeywell Aerospace into its financial results. The historical financial results of Honeywell Aerospace will be reflected in Honeywell Technologies’ consolidated financial statements as discontinued operations under GAAP for all periods beginning in the third quarter of 2026. In addition, following completion of the Aerospace Spin-Off, we now manage our businesses through three reportable business segments: Building Automation, Process Automation and Technology, and Industrial Automation.
On July 17, 2026, we acquired Johnson Matthey’s Catalyst Technologies business segment for total consideration of $1,750 million, net of cash acquired.
SEGMENT REALIGNMENT
Effective in the first quarter of 2026, we realigned certain of our business units comprising our Industrial Automation and Energy and Sustainability Solutions reportable business segments. This realignment formed a new reportable business segment, Process Automation and Technology, and resulted in a new composition of our Industrial Automation reportable business segment. Process Automation and Technology is comprised of UOP, which was previously in Energy and Sustainability Solutions, and the core portion of the Process Solutions business, which was previously in Industrial Automation. The new composition of Industrial Automation continues to include the smart energy, thermal solutions, and process measurement and control businesses, previously included in the Process Solutions business, as well as the Sensing and Safety Technologies, Warehouse and Workflow Solutions, and Productivity Solutions and Services businesses. Following the realignment, our reportable business segments were Aerospace Technologies, Building Automation, Process Automation and Technology, and Industrial Automation. In addition to the realignment, also beginning in 2026, we report the disaggregation of revenue within our Building Automation, Process Automation and Technology, and Industrial Automation segments based on business models. The realignment had no impact on our historical consolidated financial position, results of operations, or cash flows. Prior period amounts have been recast to reflect this change.
OTHER MATTERS
On June 29, 2026, following completion of the Aerospace Spin-Off as described above, the Company effected a one-for-two reverse stock split (the Reverse Stock Split) and proportionate reduction in the number of authorized shares of common stock. As a result of the Reverse Stock Split, every two shares of common stock issued and outstanding or held by Honeywell Technologies as treasury shares were automatically combined into one share of common stock, and the number of authorized shares of common stock was reduced from 2 billion to 1 billion with no change in par value. Any fractional shares were settled in cash. All share and per share amounts have been retrospectively adjusted to reflect the Reverse Stock Split for all periods presented.
RESULTS OF OPERATIONS
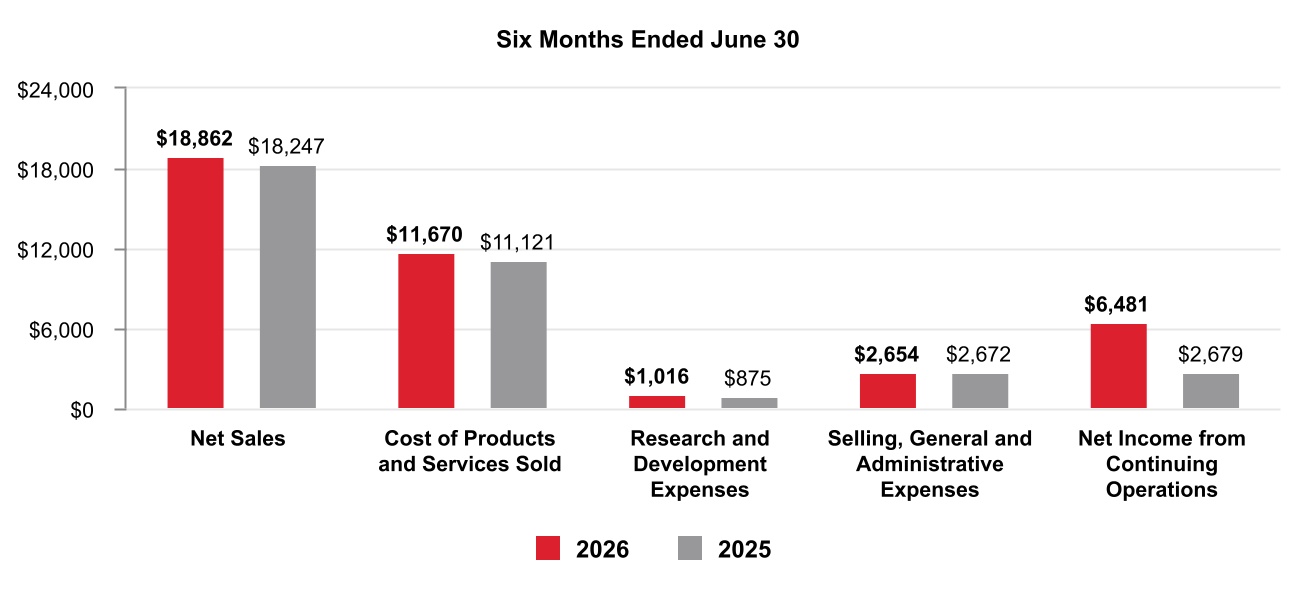
Consolidated Financial Results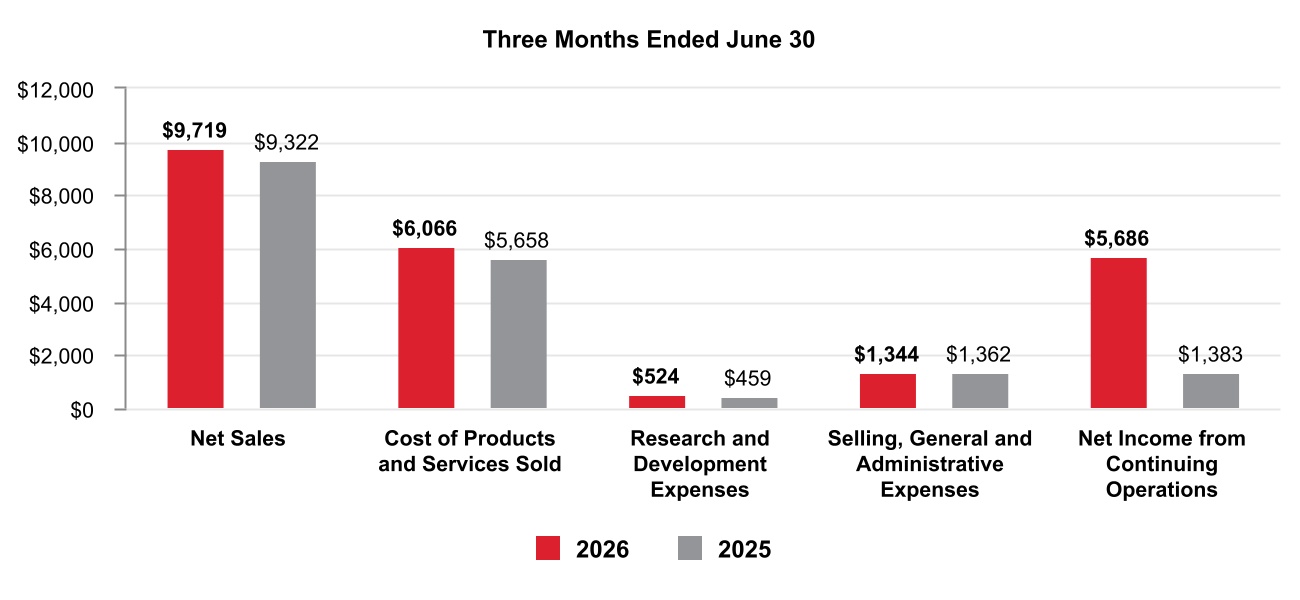
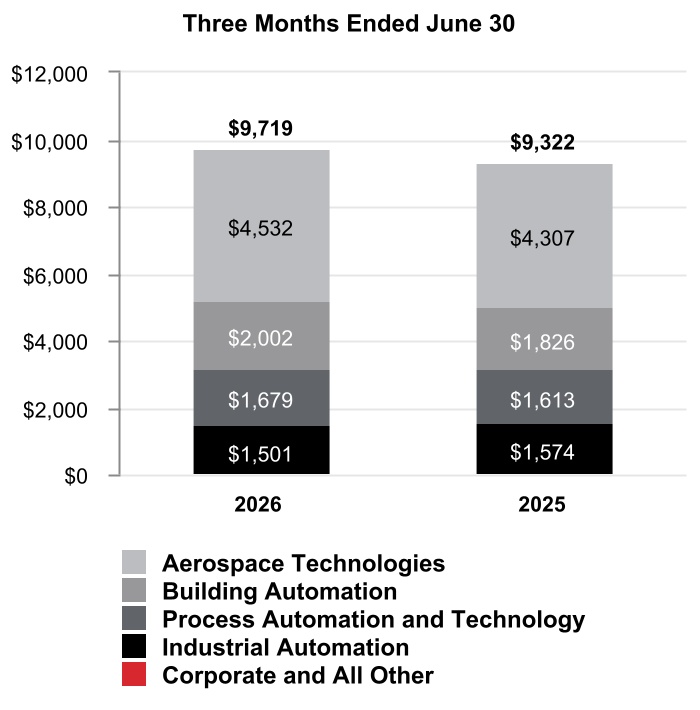
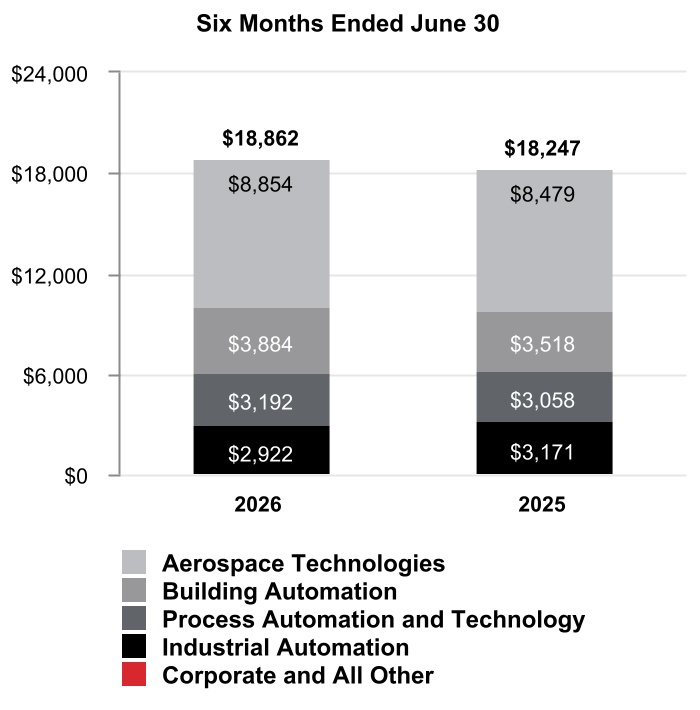
Net Sales by Segment
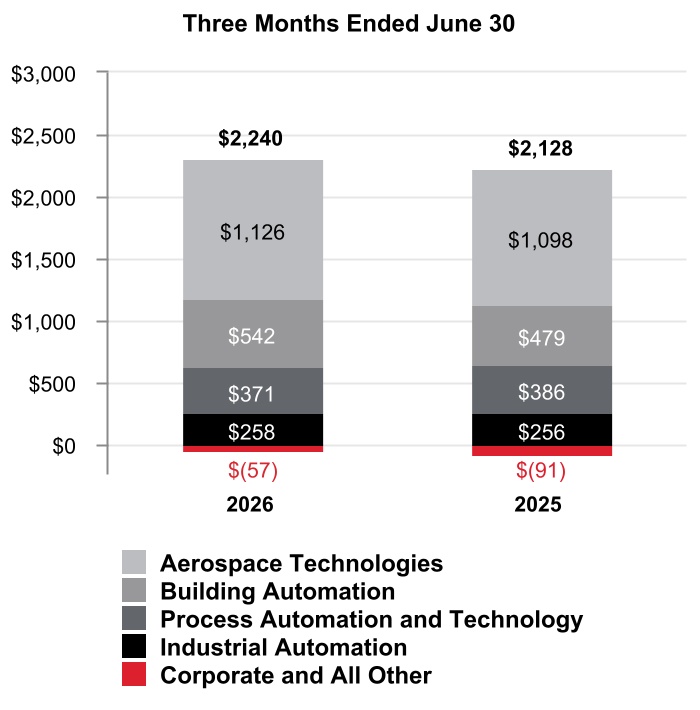
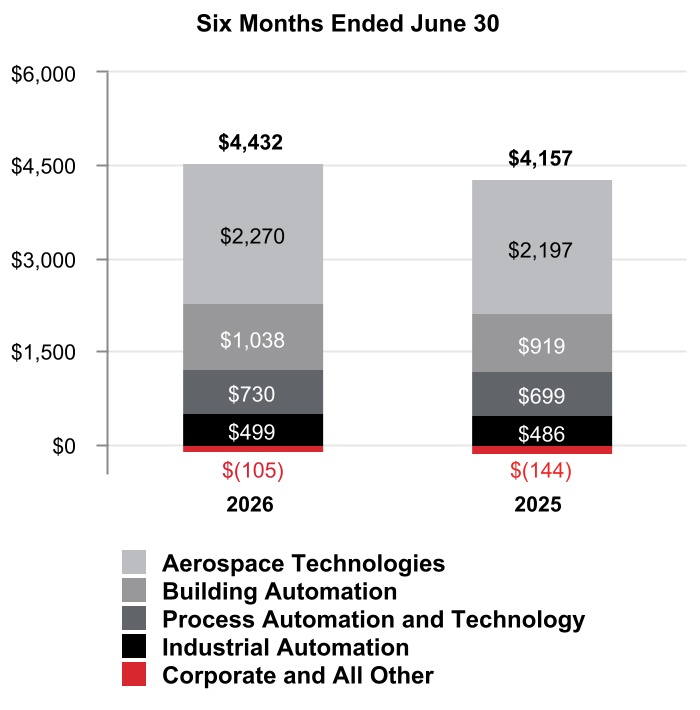
Segment Profit by Segment
CONSOLIDATED OPERATING RESULTS
Net Sales
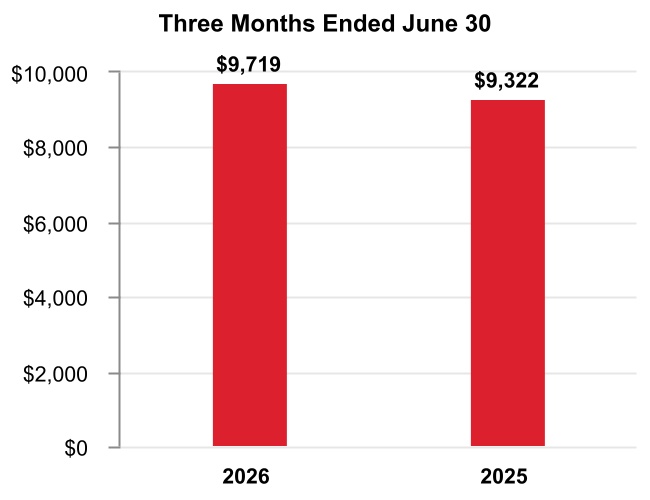
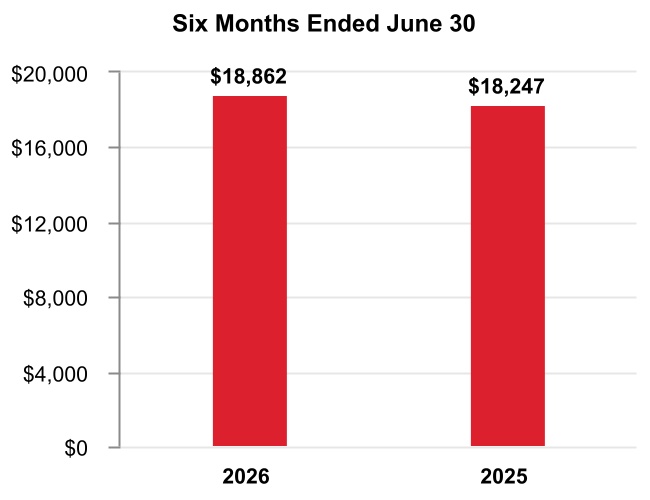
The change in Net sales was attributable to the following:
Q2 2026 vs. Q2 2025 | Year to Date | ||||||||||
| Volume | — % | (1 %) | |||||||||
| Price | 4 % | 4 % | |||||||||
| Foreign currency translation | 1 % | 1 % | |||||||||
Acquisitions | 1 % | 1 % | |||||||||
Divestitures | (2 %) | (2 %) | |||||||||
Other | — % | — % | |||||||||
| Total % change in Net sales | 4 % | 3 % | |||||||||
A discussion of Net sales by reportable business segment can be found in the Review of Business Segments section of this Management’s Discussion and Analysis.
Q2 2026 compared with Q2 2025
Net sales increased due to the following:
•Increased pricing and price adjustments to offset inflation,
•Favorable impact of foreign currency translation, driven by the weakening of the U.S. dollar against the currencies in certain of our international markets, primarily the Australian dollar and Chinese renminbi, and
•Incremental sales from recent acquisitions,
•Partially offset by lower sales from the divestiture of the personal protective equipment (PPE) business.
YTD 2026 compared with YTD 2025
Net sales increased due to the following:
•Increased pricing and price adjustments to offset inflation, and
•Incremental sales from recent acquisitions,
•Partially offset by lower sales from the divestiture of the PPE business, and
•Lower sales volumes.
Cost of Products and Services Sold
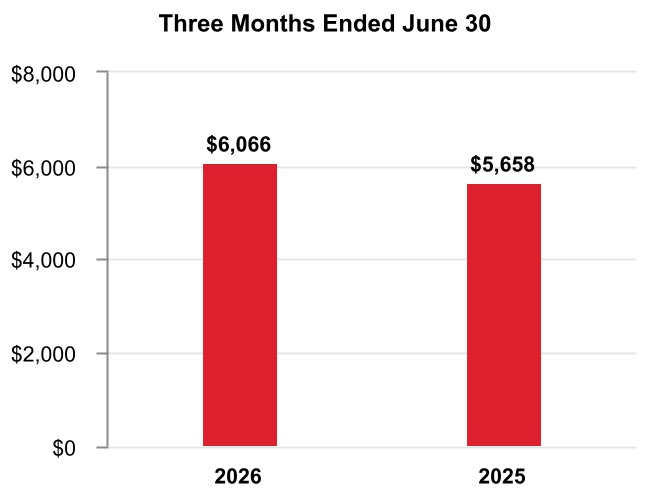
Q2 2026 compared with Q2 2025
Cost of products and services sold increased due to higher direct and indirect material costs and higher labor costs.
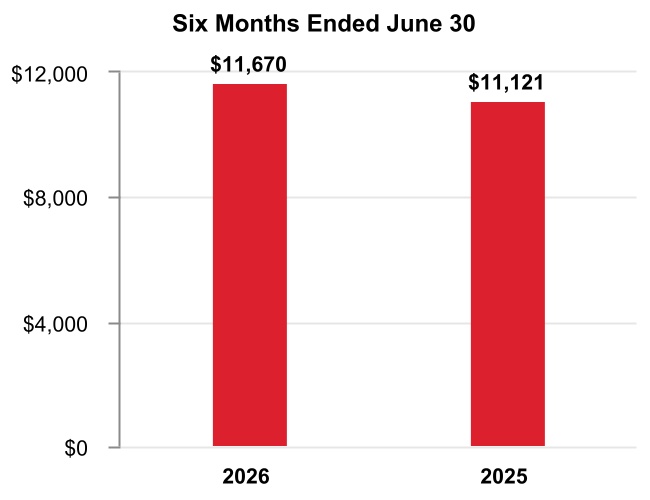
YTD 2026 compared with YTD 2025
Cost of products and services sold increased due to the following:
•Higher direct and indirect material costs and higher labor costs of approximately $0.4 billion or 4%, and
•Incremental costs from recent acquisitions of approximately $0.2 billion or 2%.
Gross Margin
Q2 2026 compared with Q2 2025
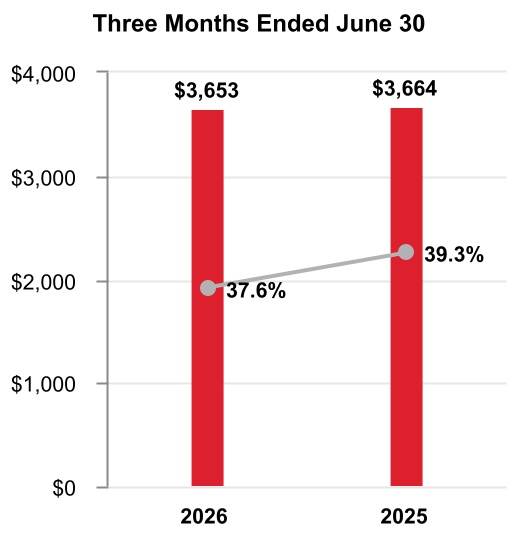
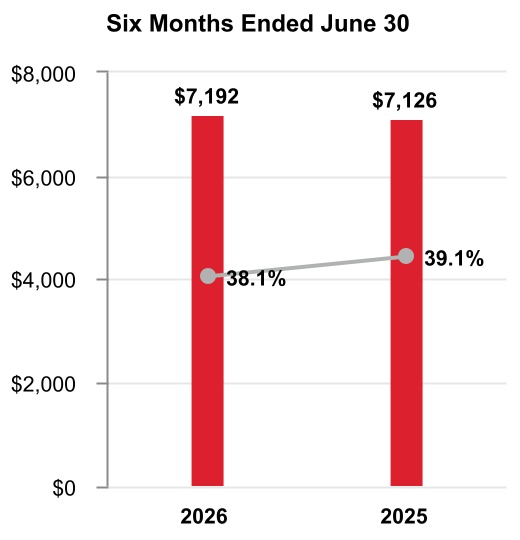
Gross margin was flat and gross margin percentage decreased 170 basis points to 37.6% compared to 39.3% for the same period of 2025.
YTD 2026 compared with YTD 2025
Gross margin increased by approximately $0.1 billion and gross margin percentage decreased 100 basis points to 38.1% compared to 39.1% for the same period of 2025.
Research and Development Expenses
Q2 2026 compared with Q2 2025
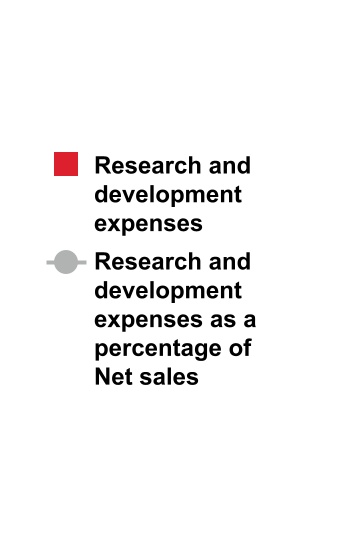
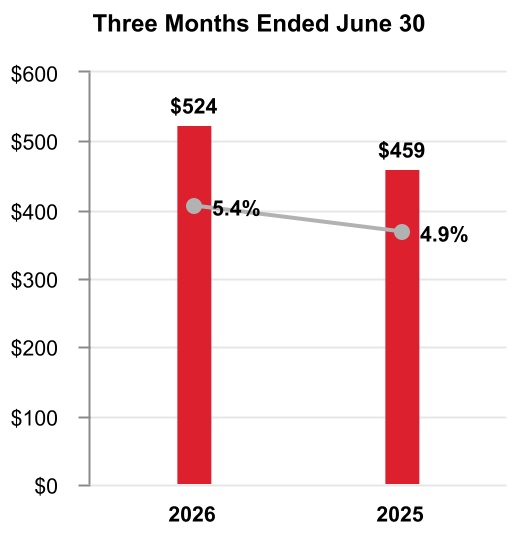
Research and development expenses increased as a percentage of net sales due to increased investment in new product development in our Aerospace Technologies business.
YTD 2026 compared with YTD 2025
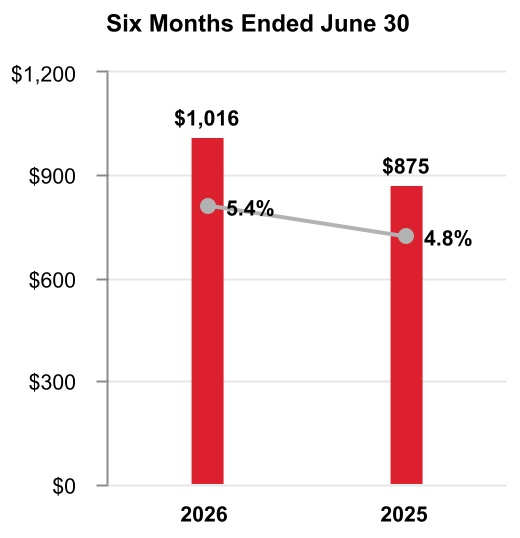
Research and development expenses increased as a percentage of net sales due to increased investment in new product development in our Aerospace Technologies business.
A summary of our research and development costs is as follows:
| Three Months Ended June 30, | Six Months Ended June 30, | ||||||||||||||||||||||
| 2026 | 2025 | 2026 | 2025 | ||||||||||||||||||||
| Company funded research and development expenses | $ | 524 | $ | 459 | $ | 1,016 | $ | 875 | |||||||||||||||
Customer-sponsored research and development1 | 304 | 260 | 570 | 527 | |||||||||||||||||||
| Total research and development costs | $ | 828 | $ | 719 | $ | 1,586 | $ | 1,402 | |||||||||||||||
| 1 | Includes deferred customer funded nonrecurring engineering and development activities and expenditures on customer programs with a significant engineering performance obligation, included in Cost of products and services sold in the Consolidated Statement of Operations. | ||||
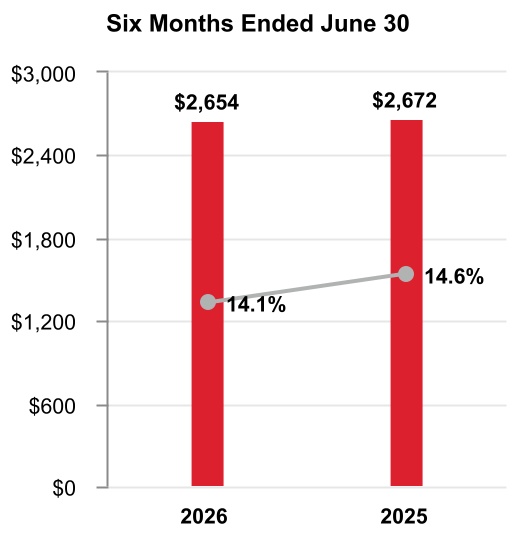
Selling, General and Administrative Expenses
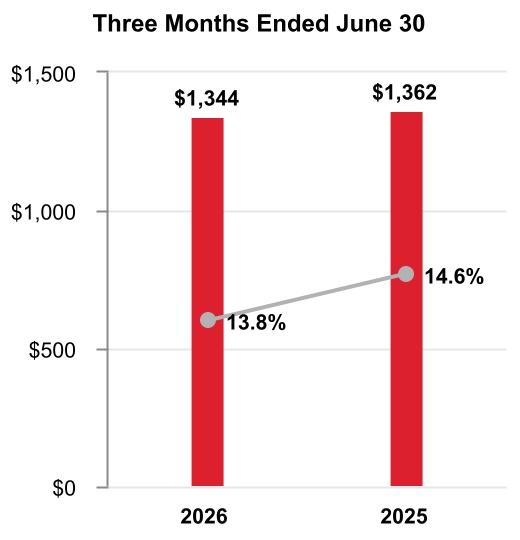
Q2 2026 compared with Q2 2025
Selling, general and administrative expenses were flat compared to the same period in 2025.
YTD 2026 compared to YTD 2025
Selling, general and administrative expenses were flat compared to the same period in 2025.
Impairment of Assets Held for Sale
| Three Months Ended June 30, | Six Months Ended June 30, | ||||||||||||||||||||||
| 2026 | 2025 | 2026 | 2025 | ||||||||||||||||||||
| Impairment of assets held for sale | $ | 48 | $ | — | $ | 311 | $ | 15 | |||||||||||||||
Q2 2026 compared with Q2 2025
Impairment of assets held for sale increased due to an impairment charge recorded on the assets held for sale related to the Productivity Solutions and Services and Warehouse and Workflow Solutions businesses for the three months ended June 30, 2026.
YTD 2026 compared to YTD 2025
Impairment of assets held for sale increased due to impairment charges recorded on the assets held for sale related to the Productivity Solutions and Services and Warehouse and Workflow Solutions businesses for the six months ended June 30, 2026.
Loss on Debt Extinguishment
| Three Months Ended June 30, | Six Months Ended June 30, | ||||||||||||||||||||||
| 2026 | 2025 | 2026 | 2025 | ||||||||||||||||||||
| Loss on debt extinguishment | $ | 2 | $ | — | $ | 241 | $ | — | |||||||||||||||
Q2 2026 compared with Q2 2025
Loss on debt extinguishment in the three months ended June 30, 2026 was due to the debt redemptions.
YTD 2026 compared to YTD 2025
Loss on debt extinguishment in the six months ended June 30, 2026 was due to the debt tender offers and redemptions.
Gain on Deconsolidation of Subsidiary
| Three Months Ended June 30, | Six Months Ended June 30, | ||||||||||||||||||||||
| 2026 | 2025 | 2026 | 2025 | ||||||||||||||||||||
| Gain on deconsolidation of subsidiary | $ | (6,629) | $ | — | $ | (6,629) | $ | — | |||||||||||||||
Q2 2026 compared with Q2 2025
Gain on deconsolidation of subsidiary in the three months ended June 30, 2026 was due to the deconsolidation of Quantinuum.
YTD 2026 compared to YTD 2025
Gain on deconsolidation of subsidiary in the six months ended June 30, 2026 was due to the deconsolidation of Quantinuum.
Other (Income) Expense
| Three Months Ended June 30, | Six Months Ended June 30, | ||||||||||||||||||||||
| 2026 | 2025 | 2026 | 2025 | ||||||||||||||||||||
| Other (income) expense | $ | 472 | $ | (113) | $ | 465 | $ | (342) | |||||||||||||||
Q2 2026 compared with Q2 2025
Other income decreased due to the following:
•Higher divestiture-related costs related to the Aerospace Spin-Off of approximately $0.7 billion,
•Partially offset by higher pension income of approximately $0.1 billion.
YTD 2026 compared to YTD 2025
Other income decreased due to the following:
•Higher divestiture-related costs related to the Aerospace Spin-Off of approximately $0.9 billion,
•Partially offset by higher pension income of approximately $0.1 billion.
Interest and Other Financial Charges
| Three Months Ended June 30, | Six Months Ended June 30, | ||||||||||||||||||||||
| 2026 | 2025 | 2026 | 2025 | ||||||||||||||||||||
| Interest and other financial charges | $ | 363 | $ | 329 | $ | 719 | $ | 614 | |||||||||||||||
Q2 2026 compared with Q2 2025
Interest and other financial charges increased due to the increase in debt from pre-separation debt financing in advance of the Aerospace Spin-Off net of debt tender offers and redemptions.
YTD 2026 compared to YTD 2025
Interest and other financial charges increased due to the increase in debt from pre-separation debt financing in advance of the Aerospace Spin-Off net of debt tender offers and redemptions.
Tax Expense
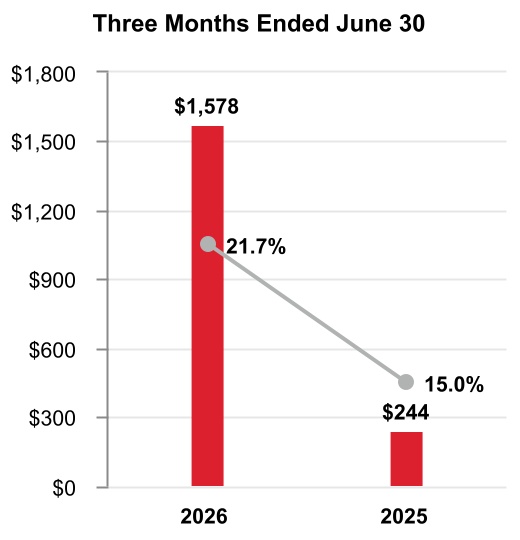
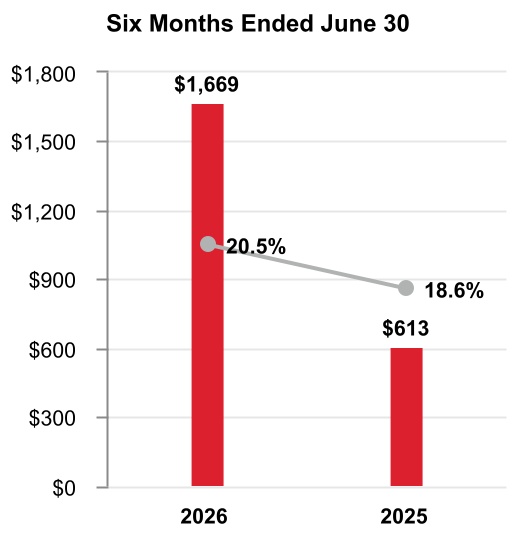
Q2 2026 compared with Q2 2025
The effective tax rate increased 670 basis points due to the following:
•Changes in accruals on foreign tax matters and transaction related tax costs primarily related to the Quantinuum deconsolidation and Aerospace Spin-Off of 1,020 basis points,
•Partially offset by changes in valuation allowance of 380 basis points.
YTD 2026 compared with YTD 2025
The effective tax rate increased 190 basis points due to the following:
•Changes in accruals on foreign tax matters of 560 basis points,
•Partially offset by changes in valuation allowance of 340 basis points.
Equity Loss
| Three Months Ended June 30, | Six Months Ended June 30, | ||||||||||||||||||||||
| 2026 | 2025 | 2026 | 2025 | ||||||||||||||||||||
| Equity loss | $ | 265 | $ | — | $ | 265 | $ | — | |||||||||||||||
Q2 2026 compared with Q2 2025
Equity loss in the three months ended June 30, 2026 was due to equity losses on Quantinuum following the deconsolidation of Quantinuum in the second quarter of 2026.
YTD 2026 compared to YTD 2025
Equity loss in the six months ended June 30, 2026 was due to equity losses on Quantinuum following the deconsolidation of Quantinuum in the second quarter of 2026.
Net Income from Continuing Operations
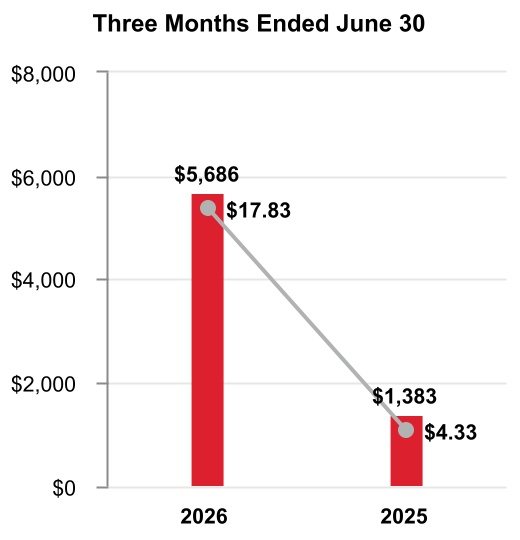
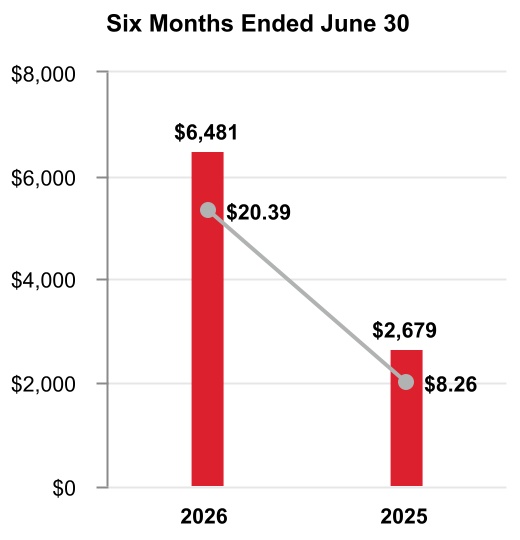
Q2 2026 compared to Q2 2025
Earnings per share of common stock–assuming dilution increased due to the following:
•Gain on deconsolidation of Quantinuum ($15.78 after tax),
•Partially offset by higher divestiture-related costs ($1.54 after tax).
YTD 2026 compared with YTD 2025
Earnings per share of common stock–assuming dilution increased due to the following:
•Gain on deconsolidation of Quantinuum ($15.65 after tax),
•Partially offset by higher divestiture-related costs ($2.05 after tax), and
•Higher debt restructuring costs ($0.80 after tax).
BACKLOG
Our backlog of orders increased 12% to $38.0 billion as of June 30, 2026, compared to June 30, 2025. Backlog represents the estimated remaining value of work to be performed or products to be shipped under firm contracts. Backlog is equal to our remaining performance obligations under the contracts that meet the guidance on revenue from contracts with customers as discussed in Note 4 Revenue Recognition and Contracts with Customers of Notes to Consolidated Financial Statements. Our backlog by reportable business segment is as follows:
June 30, 2026 | |||||
| Aerospace Technologies | $ | 18,435 | |||
| Building Automation | 9,258 | ||||
Process Automation and Technology | 7,640 | ||||
| Industrial Automation | 2,675 | ||||
| Total backlog | $ | 38,008 | |||
REVIEW OF BUSINESS SEGMENTS
During the first quarter of 2026, the Company realigned certain of its business units as reflected in Note 18 Segment Financial Data, which impacts the composition of its reportable segments. The Company recast historical periods to reflect this change in segment presentation. See Note 18 Segment Financial Data to Notes to Consolidated Financial Statements for further discussion.
During the period reflected in the Quarterly Report on Form 10-Q, we globally managed our business operations through four reportable business segments: Aerospace Technologies, Building Automation, Process Automation and Technology, and Industrial Automation. Upon the Aerospace Spin-Off, we now manage our businesses through three reportable business segments: Building Automation, Process Automation and Technology, and Industrial Automation.
AEROSPACE TECHNOLOGIES
Effective the third quarter of 2026, the results of Aerospace Technologies will be reported within discontinued operations.
Net Sales
| Three Months Ended June 30, | Six Months Ended June 30, | ||||||||||||||||||||||||||||||||||
| 2026 | 2025 | % Change | 2026 | 2025 | % Change | ||||||||||||||||||||||||||||||
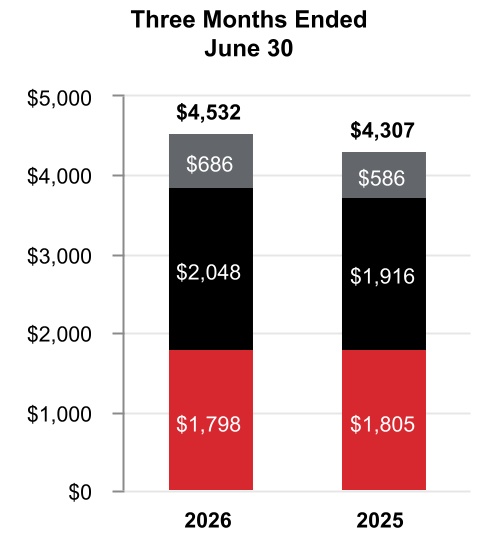
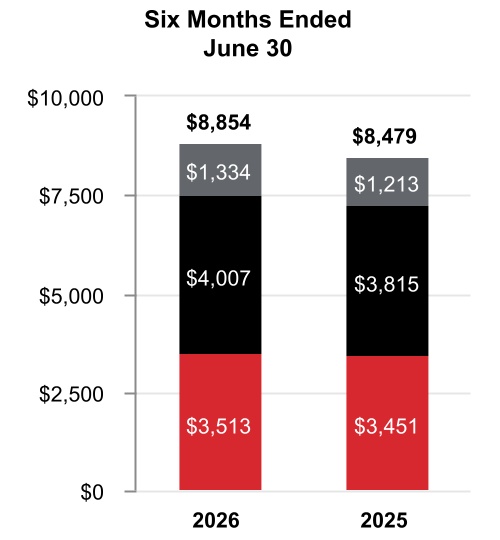
| Net sales | $ | 4,532 | $ | 4,307 | 5 | % | $ | 8,854 | $ | 8,479 | 4 | % | |||||||||||||||||||||||
| Cost of products and services sold | 2,889 | 2,718 | 5,564 | 5,310 | |||||||||||||||||||||||||||||||
| Selling, general and administrative and other expenses | 517 | 491 | 1,020 | 972 | |||||||||||||||||||||||||||||||
| Segment profit | $ | 1,126 | $ | 1,098 | 2 | % | $ | 2,270 | $ | 2,197 | 3 | % | |||||||||||||||||||||||
2026 vs. 2025 | |||||||||||||||||||||||
| Three Months Ended June 30, | Six Months Ended June 30, | ||||||||||||||||||||||
| Factors Contributing to Year-Over-Year Change | Net Sales | Segment Profit | Net Sales | Segment Profit | |||||||||||||||||||
Reported percent change | 5 | % | 2 | % | 4 | % | 3 | % | |||||||||||||||
| Less: Impact of divestitures to the prior period | — | % | — | % | — | % | — | % | |||||||||||||||
Reported percent change, adjusted for impact of divestitures | 5 | % | 2 | % | 4 | % | 3 | % | |||||||||||||||
| Less: Foreign currency translation | — | % | — | % | — | % | — | % | |||||||||||||||
| Less: Acquisitions | — | % | — | % | — | % | — | % | |||||||||||||||
| Less: Other | — | % | — | % | — | % | — | % | |||||||||||||||
Organic percent change1 | 5 | % | 2 | % | 4 | % | 3 | % | |||||||||||||||
1 | Organic sales % change, presented for all of our reportable business segments, is defined as the change in Net sales, adjusted for the impact of divestitures to the prior period, and excluding the impact on sales from foreign currency translation, acquisitions for the first 12 months following the transaction date, and certain other items that are unusual or non-recurring in nature. We believe this non-GAAP measure is useful to investors and management in understanding the ongoing operations and analysis of ongoing operating trends. | |||||||
Q2 2026 compared to Q2 2025
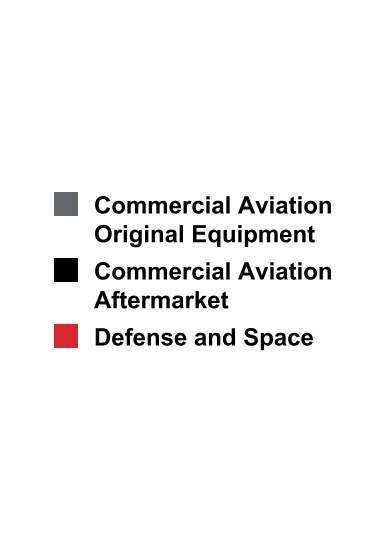
Sales increased $225 million due to higher organic sales of $128 million in Commercial Aviation Aftermarket driven by increased pricing and higher organic sales of $100 million in Commercial Aviation Original Equipment driven by increased volume.
Segment profit increased $28 million and segment margin percentage decreased 70 basis points to 24.8% compared to 25.5% for the same period of 2025.
YTD 2026 compared to YTD 2025
Sales increased $375 million due to higher organic sales of $182 million in Commercial Aviation Aftermarket and higher organic sales of $118 million in Commercial Aviation Original Equipment, both driven by increased pricing.
Segment profit increased $73 million and segment margin percentage decreased 30 basis points to 25.6% compared to 25.9% for the same period of 2025. Segment profit benefitted from higher organic sales driven by increased pricing, offset by an increase in inventory obsolescence charges of approximately $60 million, partially attributable to higher inventory balances.
BUILDING AUTOMATION
Net Sales
| Three Months Ended June 30, | Six Months Ended June 30, | ||||||||||||||||||||||||||||||||||
| 2026 | 2025 | % Change | 2026 | 2025 | % Change | ||||||||||||||||||||||||||||||
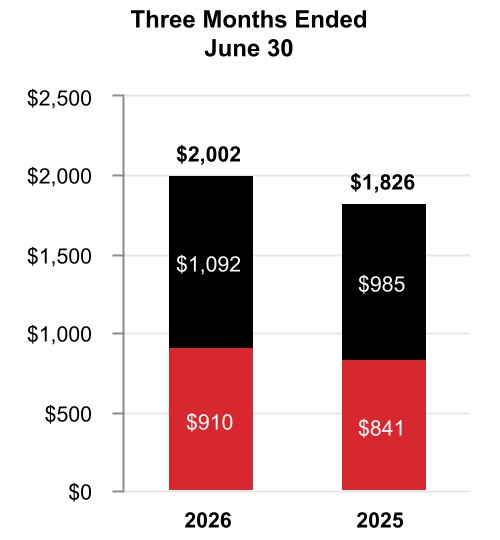
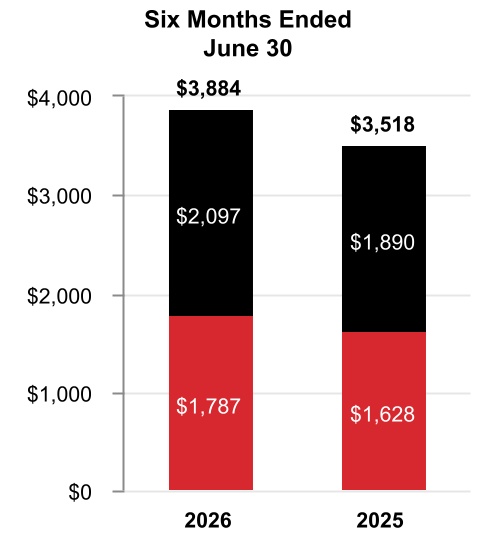
| Net sales | $ | 2,002 | $ | 1,826 | 10 | % | $ | 3,884 | $ | 3,518 | 10 | % | |||||||||||||||||||||||
| Cost of products and services sold | 1,065 | 944 | 2,058 | 1,812 | |||||||||||||||||||||||||||||||
| Selling, general and administrative and other expenses | 395 | 403 | 788 | 787 | |||||||||||||||||||||||||||||||
| Segment profit | $ | 542 | $ | 479 | 13 | % | $ | 1,038 | $ | 919 | 13 | % | |||||||||||||||||||||||
2026 vs. 2025 | |||||||||||||||||||||||
| Three Months Ended June 30, | Six Months Ended June 30, | ||||||||||||||||||||||
| Factors Contributing to Year-Over-Year Change | Net Sales | Segment Profit | Net Sales | Segment Profit | |||||||||||||||||||
Reported percent change | 10 | % | 13 | % | 10 | % | 13 | % | |||||||||||||||
| Less: Impact of divestitures to the prior period | — | % | — | % | — | % | — | % | |||||||||||||||
Reported percent change, adjusted for impact of divestitures | 10 | % | 13 | % | 10 | % | 13 | % | |||||||||||||||
| Less: Foreign currency translation | 1 | % | 1 | % | 2 | % | 3 | % | |||||||||||||||
| Less: Acquisitions | — | % | — | % | — | % | — | % | |||||||||||||||
| Less: Other | — | % | — | % | — | % | — | % | |||||||||||||||
Organic percent change | 9 | % | 12 | % | 8 | % | 10 | % | |||||||||||||||
Q2 2026 compared to Q2 2025
Sales increased $176 million due to higher organic sales of $103 million in Products and higher organic sales of $59 million in Solutions, both driven by higher demand.
Segment profit increased $63 million and segment margin percentage increased 90 basis points to 27.1% compared to 26.2% for the same period of 2025.
YTD 2026 compared to YTD 2025
Sales increased $366 million due to higher organic sales of $174 million in Products and higher organic sales of $120 million in Building Solutions, both driven by higher demand.
Segment profit increased $119 million and segment margin percentage increased 60 basis points to 26.7% compared to 26.1% for the same period of 2025.
PROCESS AUTOMATION AND TECHNOLOGY
Net Sales
| Three Months Ended June 30, | Six Months Ended June 30, | ||||||||||||||||||||||||||||||||||
| 2026 | 2025 | % Change | 2026 | 2025 | % Change | ||||||||||||||||||||||||||||||
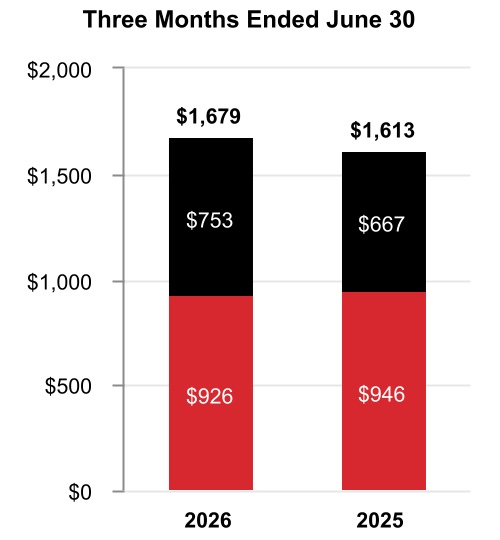
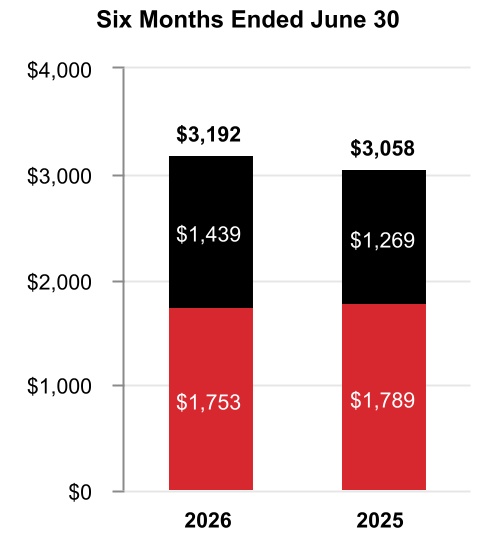
| Net sales | $ | 1,679 | $ | 1,613 | 4 | % | $ | 3,192 | $ | 3,058 | 4 | % | |||||||||||||||||||||||
| Cost of products and services sold | 985 | 896 | 1,841 | 1,705 | |||||||||||||||||||||||||||||||
| Selling, general and administrative and other expenses | 323 | 331 | 621 | 654 | |||||||||||||||||||||||||||||||
| Segment profit | $ | 371 | $ | 386 | (4) | % | $ | 730 | $ | 699 | 4 | % | |||||||||||||||||||||||
2026 vs. 2025 | |||||||||||||||||||||||
| Three Months Ended June 30, | Six Months Ended June 30, | ||||||||||||||||||||||
| Factors Contributing to Year-Over-Year Change | Net Sales | Segment Profit | Net Sales | Segment Profit | |||||||||||||||||||
Reported percent change | 4 | % | (4) | % | 4 | % | 4 | % | |||||||||||||||
| Less: Impact of divestitures to the prior period | — | % | — | % | — | % | — | % | |||||||||||||||
Reported percent change, adjusted for impact of divestitures | 4 | % | (4) | % | 4 | % | 4 | % | |||||||||||||||
| Less: Foreign currency translation | — | % | 1 | % | 1 | % | 1 | % | |||||||||||||||
| Less: Acquisitions | 5 | % | 5 | % | 6 | % | 8 | % | |||||||||||||||
| Less: Other | — | % | — | % | — | % | — | % | |||||||||||||||
Organic percent change | (1) | % | (10) | % | (3) | % | (5) | % | |||||||||||||||
Q2 2026 compared to Q2 2025
Sales increased $66 million due to inorganic sales of $78 million in Sundyne during the three months ended June 30, 2026 and higher organic sales of $54 million in Projects driven by increased volume, partially offset by lower organic sales of $77 million in Aftermarket driven by a decline in catalyst shipments.
Segment profit decreased $15 million and segment margin percentage decreased 180 basis points to 22.1% compared to 23.9% for the same period of 2025.
YTD 2026 compared to YTD 2025
Sales increased $134 million due to inorganic sales of $199 million in Sundyne during the six months ended June 30, 2026 and higher organic sales of $53 million in Projects driven by increased volume, partially offset by lower organic sales of $159 million in Aftermarket driven by a decline in catalyst shipments.
Segment profit increased $31 million and segment margin percentage remained flat at 22.9% compared to 22.9% for the same period of 2025.
INDUSTRIAL AUTOMATION
Net Sales
| Three Months Ended June 30, | Six Months Ended June 30, | ||||||||||||||||||||||||||||||||||
| 2026 | 2025 | % Change | 2026 | 2025 | % Change | ||||||||||||||||||||||||||||||
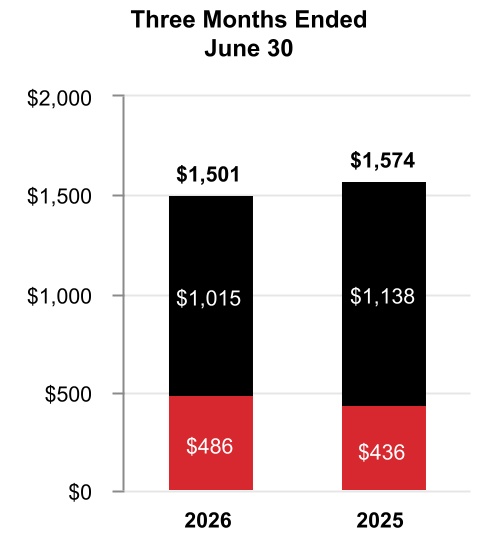
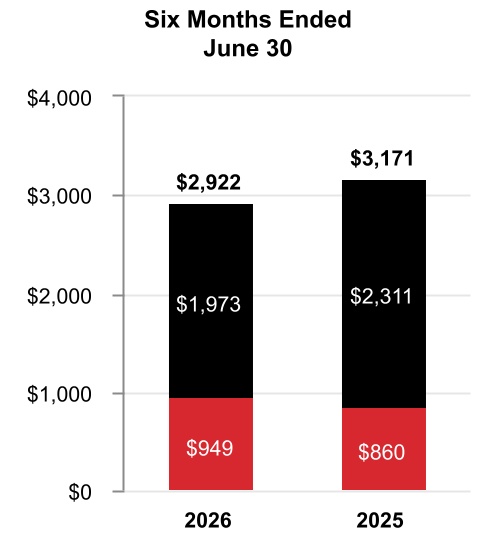
| Net sales | $ | 1,501 | $ | 1,574 | (5) | % | $ | 2,922 | $ | 3,171 | (8) | % | |||||||||||||||||||||||
| Cost of products and services sold | 933 | 957 | 1,797 | 1,946 | |||||||||||||||||||||||||||||||
| Selling, general and administrative and other expenses | 310 | 361 | 626 | 739 | |||||||||||||||||||||||||||||||
| Segment profit | $ | 258 | $ | 256 | 1 | % | $ | 499 | $ | 486 | 3 | % | |||||||||||||||||||||||
2026 vs. 2025 | |||||||||||||||||||||||
| Three Months Ended June 30, | Six Months Ended June 30, | ||||||||||||||||||||||
| Factors Contributing to Year-Over-Year Change | Net Sales | Segment Profit | Net Sales | Segment Profit | |||||||||||||||||||
Reported percent change | (5) | % | 1 | % | (8) | % | 3 | % | |||||||||||||||
| Less: Impact of divestitures to the prior period | (9) | % | (2) | % | (12) | % | (6) | % | |||||||||||||||
Reported percent change, adjusted for impact of divestitures | 4 | % | 3 | % | 4 | % | 9 | % | |||||||||||||||
| Less: Foreign currency translation | — | % | 2 | % | 1 | % | 2 | % | |||||||||||||||
| Less: Acquisitions | — | % | — | % | — | % | — | % | |||||||||||||||
| Less: Other | — | % | — | % | — | % | — | % | |||||||||||||||
Organic percent change | 4 | % | 1 | % | 3 | % | 7 | % | |||||||||||||||
Q2 2026 compared to Q2 2025
Sales decreased $73 million due to lower sales of $145 million driven by the sale of our PPE business on May 21, 2025, partially offset by higher organic sales of $47 million in Solutions driven by project timing.
Segment profit increased $2 million and segment margin percentage increased 90 basis points to 17.2% compared to 16.3% for the same period in 2025.
YTD 2026 compared to YTD 2025
Sales decreased $249 million due to lower sales of $381 million driven by the sale of our PPE business on May 21, 2025, partially offset by higher organic sales of $78 million in Solutions driven by project timing.
Segment profit increased $13 million and segment margin percentage increased 180 basis points to 17.1% compared to 15.3% for the same period of 2025.
On July 8, 2025, the Company announced it was evaluating strategic alternatives for its Productivity Solutions and Services and Warehouse and Workflow Solutions businesses. Following the Company’s strategic review, the assets and liabilities of these businesses were classified as held for sale beginning December 31, 2025. In April 2026, the Company announced it has reached agreements to sell the businesses in two transactions, both of which are expected to close in the third quarter of 2026 and are subject to customary closing conditions, including receipt of certain regulatory approvals.
CORPORATE AND ALL OTHER
Corporate and All Other primarily includes unallocated corporate costs, interest expense on holding-company debt, and the former controlling majority-owned interest in Quantinuum prior to deconsolidation in the second quarter of 2026. Corporate expenses historically allocated to the Advanced Materials business prior to it being spun off in the fourth quarter of 2025 and not eligible to be part of discontinued operations are now included in Corporate and All Other. Corporate and All Other is not a separate reportable business segment as segment reporting criteria is not met. The Company continues to monitor the activities in Corporate and All Other to determine the need for further reportable business segment disaggregation.
REPOSITIONING CHARGES
See Note 5 Repositioning and Other Charges of Notes to Consolidated Financial Statements for a discussion of our repositioning actions and related charges incurred in the six months ended June 30, 2026 and 2025. Cash spending related to our repositioning actions was $91 million in the six months ended June 30, 2026, and was funded through operating cash flows.
LIQUIDITY AND CAPITAL RESOURCES
(Dollars in tables in millions)
We leverage operating cash flows as the primary source of liquidity. Each of our businesses focuses on increasing operating cash flows through revenue growth, margin expansion, and improved working capital turnover. We also maintain other key sources of liquidity, including U.S. cash balances, and the ability to access non-U.S. cash balances, short-term debt from the commercial paper market, long-term borrowings, committed credit lines, and access to the public debt and equity markets.
CASH
As of June 30, 2026 and December 31, 2025, we held $9.2 billion and $12.9 billion, respectively, of cash and cash equivalents, including our short-term investments. We monitor third-party depository institutions that hold our cash and cash equivalents on a daily basis. Our emphasis is primarily safety of principal and secondarily maximizing yield of those funds. We diversify our cash and cash equivalents among counterparties to minimize exposure to any one counterparty.
As of June 30, 2026, we held $6.7 billion of the Company’s cash, cash equivalents, and short-term investments in non-U.S. subsidiaries. We do not have material amounts related to any jurisdiction subject to currency control restrictions that impact our ability to access and repatriate such amounts. Under current laws, we do not expect taxes on repatriation or restrictions on amounts held outside of the U.S. to have a material effect on our overall liquidity.
CASH FLOW SUMMARY
Our cash flows from operating, investing, and financing activities, as reflected in the Consolidated Statement of Cash Flows, are summarized as follows:
| Six Months Ended June 30, | |||||||||||||||||
| 2026 | 2025 | Variance | |||||||||||||||
| Cash and cash equivalents at beginning of period | $ | 12,487 | $ | 10,567 | $ | 1,920 | |||||||||||
| Operating activities | |||||||||||||||||
Net income from continuing operations | 6,481 | 2,679 | 3,802 | ||||||||||||||
| Noncash adjustments | (4,281) | 628 | (4,909) | ||||||||||||||
| Changes in working capital | (863) | (1,179) | 316 | ||||||||||||||
| Other operating activities | (711) | (686) | (25) | ||||||||||||||
| Net cash provided by operating activities from discontinued operations | — | 474 | (474) | ||||||||||||||
| Net cash provided by operating activities | 626 | 1,916 | (1,290) | ||||||||||||||
| Net cash used for investing activities from continuing operations | (1,048) | (1,765) | 717 | ||||||||||||||
| Net cash used for investing activities from discontinued operations | — | (115) | 115 | ||||||||||||||
| Net cash used for financing activities | (3,246) | (421) | (2,825) | ||||||||||||||
| Effect of foreign exchange rate changes on cash and cash equivalents | (68) | 167 | (235) | ||||||||||||||
Net decrease in cash and cash equivalents | (3,736) | (218) | (3,518) | ||||||||||||||
| Cash and cash equivalents at end of period | $ | 8,751 | $ | 10,349 | $ | (1,598) | |||||||||||
Six months ended June 30, 2026
Net cash provided by operating activities from continuing operations was driven by operating income from continuing operations of $3,211 million, partially offset by changes in working capital of $863 million due to timing of customer cash collections, payments for divestiture-related costs of approximately $800 million, net interest payments of $482 million, and the Flexjet litigation settlement payment of $375 million.
Net cash used for investing activities from continuing operations was driven by $538 million of capital expenditures and the deconsolidation of $623 million of Quantinuum cash, partially offset by $127 million of net cash receipts from settlements of derivative contracts.
Net cash used for financing activities was driven by $13,187 million of payments of long-term debt, $3,413 million of net payments of commercial paper, $1,576 million of cash dividends paid, and $1,000 million of repurchases of common stock, partially offset by $15,835 million of pre-separation funding related to the Aerospace Spin-Off.
Six months ended June 30, 2026 compared with six months ended June 30, 2025
Net cash provided by operating activities from continuing operations decreased by $816 million, driven by cash payments resulting from an approximately $800 million increase in payments for divestiture-related costs.
Net cash used for investing activities from continuing operations decreased by $717 million, driven by a $2,135 million decrease in cash paid for acquisitions and a $542 million net increase in cash receipts from settlement of derivative contracts, partially offset by a $1,151 million decrease in proceeds from sale of businesses, the deconsolidation of $623 million of Quantinuum cash and a $122 million increase in capital expenditures.
Net cash used for financing activities increased by $2,825 million, driven by an $11,878 million increase of payments of long-term debt, a $5,286 million increase of net payments of commercial paper, and a decrease in proceeds from issuance of long-term debt of $4,035 million, partially offset by $15,835 million of pre-separation funding related to the Aerospace Spin-Off and a $2,604 million decrease in repurchases of common stock.
ASSESSMENT OF CURRENT LIQUIDITY AND CASH REQUIREMENTS
Based on past performance and current expectations, we believe our operating cash flows will be sufficient to meet our future operating cash needs for at least the next twelve months. If necessary, our available cash, committed credit lines, and access to the public debt and equity markets provide additional sources of short-term and long-term liquidity to fund current operations, debt maturities, and future investment opportunities.
See Note 9 Debt and Credit Agreements of Notes to Consolidated Financial Statements for additional discussion of items impacting our liquidity.
In addition to normal operating cash requirements, our principal future cash requirements include funding capital expenditures, share repurchases, dividends, strategic acquisitions, and debt repayments. During the six months ended June 30, 2026, we repurchased common stock of $1.0 billion. Refer to the section titled Liquidity and Capital Resources of our 2025 Form 10-K for a discussion of our expected capital expenditures, share repurchases, mergers and acquisitions activity, and dividends for 2026.
We continually assess the relative strength of each business in our portfolio as to strategic fit, market position, profit, and cash flow contribution in order to identify target investment and acquisition opportunities in order to upgrade our combined portfolio. We seek to identify acquisition candidates that will further our strategic plan and strengthen our existing core businesses. During the third quarter of 2026, we acquired Johnson Matthey’s Catalyst Technologies business segment for total consideration of $1,750 million, net of cash acquired. We also identify businesses that do not fit into our long-term strategic plan based on their market position, relative profitability, or growth potential. These businesses are considered for potential divestiture, restructuring, or other repositioning actions, subject to regulatory constraints. On July 8, 2025, we announced we are evaluating strategic alternatives for our Productivity Solutions and Services and Warehouse and Workflow Solutions businesses within the Industrial Automation reportable business segment and classified the assets and liabilities of the businesses as held for sale beginning December 31, 2025. In April 2026, the Company announced it has reached agreements to sell the businesses in two transactions, both of which are expected to close in the third quarter of 2026 and are subject to customary closing conditions, including receipt of certain regulatory approvals. On June 29, 2026, we completed the Aerospace Spin-Off. See Note 3 Acquisitions, Divestitures, and Discontinued Operations of Notes to Consolidated Financial Statements for additional discussion.
We continually seek opportunities to improve our liquidity and working capital efficiency, which includes the extension of payment terms with our suppliers and transfer of our trade receivables to unaffiliated financial institutions on a true sale basis. The impact of these programs is not material to our overall liquidity.
BORROWINGS
We leverage a variety of debt instruments to manage our overall borrowing costs. As of June 30, 2026, and December 31, 2025, our total borrowings were $34.0 billion and $34.6 billion, respectively.
| June 30, 2026 | December 31, 2025 | ||||||||||
| Fixed rate notes | $ | 28,577 | $ | 25,164 | |||||||
| Commercial paper | 2,477 | 5,892 | |||||||||
| Term loans | 2,750 | 3,750 | |||||||||
| Variable rate notes | 512 | 22 | |||||||||
| Other | 94 | 111 | |||||||||
| Fair value of hedging instruments | (75) | (79) | |||||||||
| Debt issuance costs | (347) | (280) | |||||||||
| Total borrowings | $ | 33,988 | $ | 34,580 | |||||||
A key source of liquidity is our ability to access the corporate bond markets. Through these markets, we issue a variety of long-term fixed rate notes to manage our overall funding costs.
Another key source of liquidity is our ability to access the commercial paper market. Commercial paper notes are sold at a discount or premium and have a maturity of not more than 365 days from date of issuance. Borrowings under the commercial paper program are available for general corporate purposes as well as for financing acquisitions.
In addition, we have the following loan and revolving credit agreements:
•A $6.0 billion Delayed Draw Term Loan Agreement (the 2025 Term Loan Agreement), dated as of May 7, 2025. The 2025 Term Loan Agreement is comprised of two tranches: (i) commitments to provide loans in an aggregate principal amount of up to $4.0 billion, which was fully drawn effective May 30, 2025, and (ii) commitments to provide loans in an aggregate amount of up to $2.0 billion, which expired on December 19, 2025. Amounts borrowed under the 2025 Term Loan Agreement are required to be paid no later than May 7, 2027, unless the 2025 Term Loan Agreement is terminated earlier pursuant to its terms. As of June 30, 2026, there were $2.75 billion of borrowings outstanding on the 2025 Term Loan Agreement.
•A $3.0 billion 364-day credit agreement (the 364-Day Credit Agreement) with a syndicate of banks, dated as of March 6, 2026. Upon completion of the Aerospace Spin-Off, the aggregate revolving credit commitments under the 364-Day Credit Agreement were reduced to $2.0 billion. Amounts borrowed under the 364-Day Credit Agreement are required to be repaid no later than March 5, 2027, unless (i) we elect to convert all then outstanding amounts into a term loan, upon which such amounts shall be repaid in full on March 5, 2028, or (ii) the 364-Day Credit Agreement is terminated earlier pursuant to its terms. As of June 30, 2026, there were no outstanding borrowings under the 364-Day Credit Agreement.
•A $4.0 billion five-year credit agreement (the Five-Year Credit Agreement) with a syndicate of banks, dated as of March 6, 2026. Upon completion of the Aerospace Spin-Off, the aggregate revolving credit commitments under the Five-Year Credit Agreement were reduced to $3.0 billion. Commitments under the Five-Year Credit Agreement can be increased pursuant to the terms of the Five-Year Credit Agreement to an aggregate amount not to exceed $3.5 billion. Amounts borrowed under the Five-Year Credit Agreement are required to be repaid no later than March 6, 2031, unless such date is extended pursuant to the terms of the Five-Year Credit Agreement. As of June 30, 2026, there were no outstanding borrowings under the Five-Year Credit Agreement.
See Note 9 Debt and Credit Agreements of Notes to Consolidated Financial Statements for additional information regarding our debt instruments.
We also maintain a current shelf registration statement filed with the SEC under which we may issue additional debt securities, common stock, and preferred stock that may be offered in one or more offerings on terms to be determined at the time of the offering. We anticipate that net proceeds of any offering would be used for general corporate purposes, including repayment of existing indebtedness, share repurchases, capital expenditures, and acquisitions.
CREDIT RATINGS
Our ability to access the global debt capital markets and the related cost of these borrowings is affected by the strength of our credit rating and market conditions. Our credit ratings are periodically reviewed by the major independent debt-rating agencies. As of June 30, 2026, S&P Global Inc. (S&P), Fitch Ratings Inc. (Fitch), and Moody’s Investor Service (Moody’s) have ratings on our debt set forth in the table below:
| S&P | Fitch | Moody’s | |||||||||||||||
| Outlook | Negative | Stable | Negative | ||||||||||||||
| Short-term | A-1 | F1 | P1 | ||||||||||||||
| Long-term | A | A | A2 | ||||||||||||||
On June 25, 2026, Moody’s revised their credit rating outlook from review for downgrade to negative.
OTHER MATTERS
LITIGATION
See Note 15 Commitments and Contingencies of Notes to Consolidated Financial Statements for further discussion of environmental and other litigation matters.
CRITICAL ACCOUNTING ESTIMATES
There have been no material changes to our Critical Accounting Estimates presented in our 2025 Annual Report on Form 10-K. For a discussion of the Company’s Critical Accounting Estimates, see the section titled Critical Accounting Estimates in our 2025 Annual Report on Form 10-K.
RECENT ACCOUNTING PRONOUNCEMENTS
See Note 2 Summary of Significant Accounting Policies of Notes to Consolidated Financial Statements for a discussion of recent accounting pronouncements.
ITEM 6. EXHIBITS
| Exhibit No. | Description | |||||||
| 31.1 | ||||||||
| 31.2 | ||||||||
| 101.INS | Inline XBRL Instance Document (the instance document does not appear in the Interactive Data File because its XBRL tags are embedded within the Inline XBRL document) | |||||||
| 101.SCH | Inline XBRL Taxonomy Extension Schema (filed herewith) | |||||||
| 101.CAL | Inline XBRL Taxonomy Extension Calculation Linkbase (filed herewith) | |||||||
| 101.DEF | Inline XBRL Taxonomy Extension Definition Linkbase (filed herewith) | |||||||
| 101.LAB | Inline XBRL Taxonomy Extension Label Linkbase (filed herewith) | |||||||
| 101.PRE | Inline XBRL Taxonomy Extension Presentation Linkbase (filed herewith) | |||||||
| 104 | Cover Page Interactive Data File (formatted as inline XBRL and contained in Exhibit 101) | |||||||
SIGNATURES
Pursuant to the requirements of the Securities Exchange Act of 1934, the Registrant has duly caused this report to be signed on its behalf by the undersigned thereunto duly authorized.
| HONEYWELL INTERNATIONAL INC. | ||||||||
| Date: July 23, 2026 | By: | /s/ Robert D. Mailloux | ||||||
| Robert D. Mailloux Vice President and Controller (on behalf of the Registrant and as the Registrant’s Principal Accounting Officer) | ||||||||
EXHIBIT 31.1
CERTIFICATION PURSUANT TO
SECTION 302
OF THE SARBANES-OXLEY ACT OF 2002
I, Vimal Kapur, certify that:
| 1. | I have reviewed this Quarterly Report on Form 10-Q/A of Honeywell International Inc.; | |||||||
| 2. | Based on my knowledge, this report does not contain any untrue statement of a material fact or omit to state a material fact necessary to make the statements made, in light of the circumstances under which such statements were made, not misleading with respect to the period covered by this report; | |||||||
| 3. | Based on my knowledge, the financial statements, and other financial information included in this report, fairly present in all material respects the financial condition, results of operations and cash flows of the registrant as of, and for, the periods presented in this report; | |||||||
| 4. | The registrant’s other certifying officer and I are responsible for establishing and maintaining disclosure controls and procedures (as defined in Exchange Act Rules 13a-15(e) and 15d-15(e)) and internal control over financial reporting (as defined in Exchange Act Rules 13a-15(f) and 15d-15(f)) for the registrant and have: | |||||||
| a) | designed such disclosure controls and procedures, or caused such disclosure controls and procedures to be designed under our supervision, to ensure that material information relating to the registrant, including its consolidated subsidiaries, is made known to us by others within those entities, particularly during the period in which this report is being prepared; | |||||||
| b) | designed such internal control over financial reporting, or caused such internal control over financial reporting to be designed under our supervision, to provide reasonable assurance regarding the reliability of financial reporting and the preparation of financial statements for external purposes in accordance with generally accepted accounting principles; | |||||||
| c) | evaluated the effectiveness of the registrant’s disclosure controls and procedures and presented in this report our conclusions about the effectiveness of the disclosure controls and procedures, as of the end of the period covered by this report based on such evaluation; and | |||||||
| d) | disclosed in this report any change in the registrant’s internal control over financial reporting that occurred during the registrant’s most recent fiscal quarter (the registrant’s fourth fiscal quarter in the case of an annual report) that has materially affected, or is reasonably likely to materially affect, the registrant’s internal control over financial reporting; | |||||||
| 5. | The registrant’s other certifying officer and I have disclosed, based on our most recent evaluation of internal control over financial reporting, to the registrant’s auditors and the audit committee of the registrant’s board of directors (or persons performing the equivalent functions): | |||||||
| a) | all significant deficiencies and material weaknesses in the design or operation of internal control over financial reporting which are reasonably likely to adversely affect the registrant’s ability to record, process, summarize and report financial information; and | |||||||
| b) | any fraud, whether or not material, that involves management or other employees who have a significant role in the registrant’s internal control over financial reporting. | |||||||
| Date: July 23, 2026 | By: | /s/ Vimal Kapur | ||||||
| Vimal Kapur | ||||||||
| Chairman and Chief Executive Officer | ||||||||
EXHIBIT 31.2
CERTIFICATION PURSUANT TO
SECTION 302
OF THE SARBANES-OXLEY ACT OF 2002
I, Michal Stepniak, certify that:
| 1. | I have reviewed this Quarterly Report on Form 10-Q/A of Honeywell International Inc.; | |||||||
| 2. | Based on my knowledge, this report does not contain any untrue statement of a material fact or omit to state a material fact necessary to make the statements made, in light of the circumstances under which such statements were made, not misleading with respect to the period covered by this report; | |||||||
| 3. | Based on my knowledge, the financial statements, and other financial information included in this report, fairly present in all material respects the financial condition, results of operations and cash flows of the registrant as of, and for, the periods presented in this report; | |||||||
| 4. | The registrant’s other certifying officer and I are responsible for establishing and maintaining disclosure controls and procedures (as defined in Exchange Act Rules 13a-15(e) and 15d-15(e)) and internal control over financial reporting (as defined in Exchange Act Rules 13a-15(f) and 15d-15(f)) for the registrant and have: | |||||||
| a) | designed such disclosure controls and procedures, or caused such disclosure controls and procedures to be designed under our supervision, to ensure that material information relating to the registrant, including its consolidated subsidiaries, is made known to us by others within those entities, particularly during the period in which this report is being prepared; | |||||||
| b) | designed such internal control over financial reporting, or caused such internal control over financial reporting to be designed under our supervision, to provide reasonable assurance regarding the reliability of financial reporting and the preparation of financial statements for external purposes in accordance with generally accepted accounting principles; | |||||||
| c) | evaluated the effectiveness of the registrant’s disclosure controls and procedures and presented in this report our conclusions about the effectiveness of the disclosure controls and procedures, as of the end of the period covered by this report based on such evaluation; and | |||||||
| d) | disclosed in this report any change in the registrant’s internal control over financial reporting that occurred during the registrant’s most recent fiscal quarter (the registrant’s fourth fiscal quarter in the case of an annual report) that has materially affected, or is reasonably likely to materially affect, the registrant’s internal control over financial reporting; | |||||||
| 5. | The registrant’s other certifying officer and I have disclosed, based on our most recent evaluation of internal control over financial reporting, to the registrant’s auditors and the audit committee of the registrant’s board of directors (or persons performing the equivalent functions): | |||||||
| a) | all significant deficiencies and material weaknesses in the design or operation of internal control over financial reporting which are reasonably likely to adversely affect the registrant’s ability to record, process, summarize and report financial information; and | |||||||
| b) | any fraud, whether or not material, that involves management or other employees who have a significant role in the registrant’s internal control over financial reporting. | |||||||
| Date: July 23, 2026 | By: | /s/ Michal Stepniak | ||||||
| Michal Stepniak | ||||||||
| Senior Vice President and Chief Financial Officer | ||||||||