
Investor Relations Insights: 1Q23 Frequently Asked Investor Questions
Hello,
I trust you are well. After connecting with +100 investors on the road following our 2023 Outlook, we've compiled the most Frequently Asked Investor Questions (FAIQ) from those discussions. We hope you find this helpful. As always, we appreciate your interest in Honeywell and welcome your questions.
Sean
Sean C. Meakim, CFA
Vice President, Investor Relations
Honeywell International
What are the key messages you’ve been communicating to investors to start the year?
Honeywell is well-positioned, both near- and long-term, to create value for our shareholders through our leadership in automation, sustainability, and digitalization.
- We remain fully committed to delivering on our accelerated growth algorithm that we outlined at last March’s Investor Day, which is underpinned by our digital and ISC transformations, innovation pipeline, and Accelerator operating system. Honeywell offers a compelling combination of sales growth and margin enhancement to drive through-cycle shareholder value.
- Our robust balance sheet presents further growth opportunities through accelerated capital deployment (committed to $25B+ between 2022 - 2024, with ~$8B deployed in 2022).
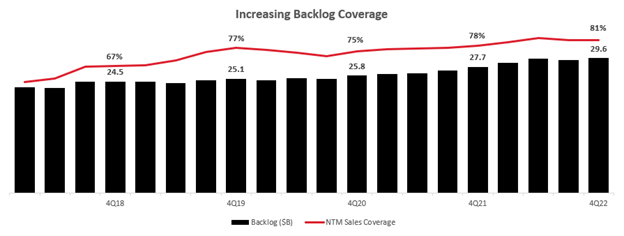
- In 2023, we expect to grow sales, expand segment margin, and increase earnings per share despite the macroeconomic environment. Record backlog of ~$30B provides good visibility, with sales coverage of 81% (based on the midpoint of our 2023 guide), up from an average 72% of initial guidance from 2019 – 2022.
- We continue to lead in ESG through both our own internal commitments (carbon neutral by 2035; addressing emissions across entire value chain) and helping customers deliver on theirs (e.g., ExxonMobil carbon capture win).
What is your outlook for 2023 and key guidance metrics for investors?
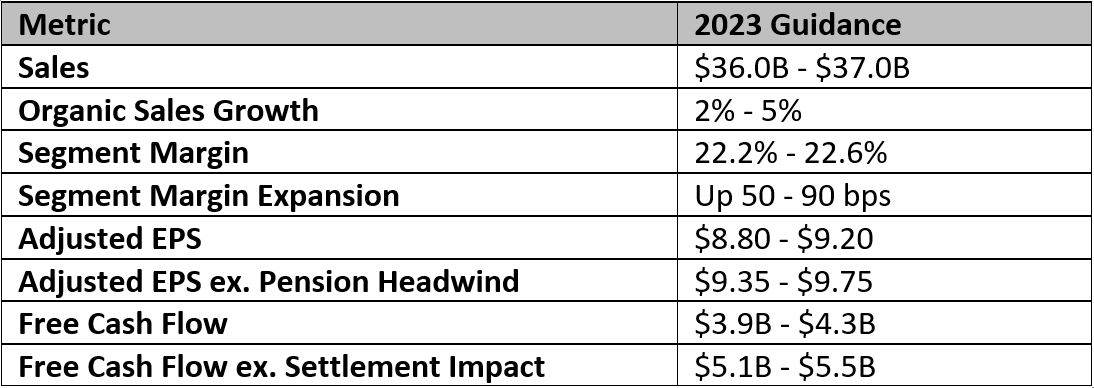
In 2023, we expect sales of $36B - $37B, representing 2% - 5% organic sales growth over 2022. Growth should be more balanced between volume and price in 2023, with stronger growth in 2H23 v. 1H23 as supply chains heal sequentially through the year.
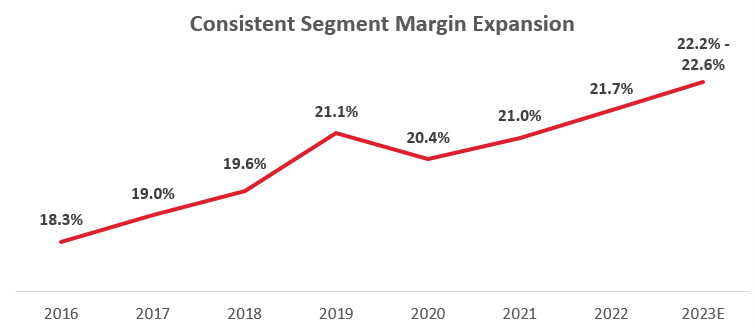
For segment margin, we expect 50 - 90 bps of expansion year over year to a range of 22.2% - 22.6%, driven by improved volume leverage, continued commercial excellence, and the benefits of ongoing programs of ISC transformation / digitalization and Honeywell Digital. These programs have generated over $2.5B in gross margin, productivity, and working capital benefits since inception and will continue to generate significant benefits in the future.
These assumptions translate into an adjusted EPS guidance range of $8.80 - $9.20, which is flat-to-up 5% year over year (or $9.35 - $9.75 excluding the impact of non-cash pension headwind, up 7% - 11%).
Finally, we expect free cash flow of $3.9B - $4.3B, or $5.1B - $5.5B when excluding the $1.2B one-time net impact of NARCO, HWI, and UOP Matters. For more on these one-time impacts to FCF, please see our January IR Insights update.
What does your guidance imply for organic volume growth in 2023? How does that compare to 2022’s results? What are the drivers across your portfolio?
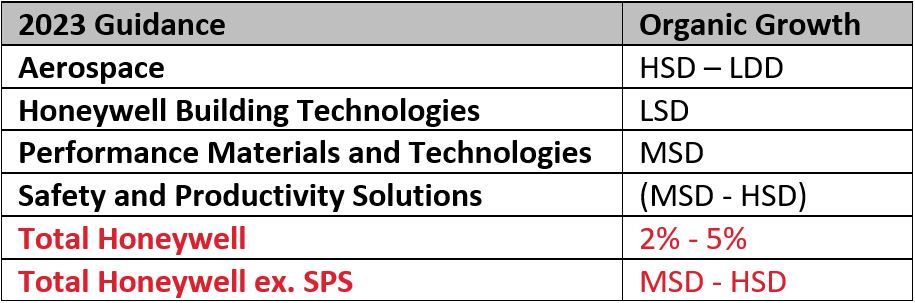
Within our 2% - 5% organic sales growth range, we assume increased price of ~4% compared to 2022, implying volumes hovering around flat year over year. However, there are some divergent trends across the portfolio that are worth unpacking to get the full picture. Our guidance assumes sales growth in three of our four SBGs (Aero, HBT, and PMT), with SPS the lone decliner (down MSD - HSD), primarily reflecting the impact of troughing activity levels in our long-cycle warehouse automation business following the pandemic boom in 2020 - 2021. Excluding SPS, the balance Honeywell portfolio implies an organic sales growth range of MSD - HSD, including LSD volume growth.
We have consistently delivered on our organic growth commitments as a result of our technological differentiation, averaging 5% organic growth from 2017 - 2022 (excluding COVID-impacted 2020).
![]()
How have orders trended recently? How much sales coverage does your backlog afford in 2023 and what level of inbound is required to meet your organic sales guide?
Similar to many other industrial companies, Honeywell experienced some slowdown in short cycle orders in 2H22 as customers in some end markets became more concerned about the economic outlook. We expect this dynamic to continue into 1H23, and it is reflected in our 2023 guidance. Yet demand remains robust across much of our portfolio, led by Aerospace, and we expect our book-to-bill to remain at or above 1x in 2023.
Further, we enter 2023 with backlog still at record levels, providing considerable coverage across even our short-cycle businesses.
How much risk is in the 2023 expectation of ~4% price? Does less pricing gain in 2023 v. 2022 imply greater risk to margin expansion?
Historically, our pricing across the portfolio has proven durable, reflecting the differentiation of our technology and solutions to our customers. Since 2005, we have averaged ~1.5% price per year, with only one recorded year of price decline (2015 at -1%). In addition, our high NPI vitality (+1100 bps over the past half-decade to 32% of revenue in 2022) has not only invigorated organic growth, but also enables an increasing share of the revenue base to come from new products which offer accretive margins.
While our ~4% guidance for 2023 price improvement is a deceleration from last year’s exceptional performance in the face of outsized inflation, volume growth should improve thanks to easing supply chain, unlocking more of our backlog. We are still in the early innings of extracting value from our investments in Honeywell Digital, which has greatly enhanced our ability to take targeted actions to drive optimized economic outcomes across our broad portfolio. We expect further enhancements to be value accretive in 2023, building on the $1.7B of gross margin, productivity, and working capital benefits we have garnered from Honeywell Digital since 2018.
Honeywell is guiding an acceleration in Aerospace sales in 2023: how much supply chain improvement is expected? What are the underlying end market assumptions of that growth, including in defense and space?
Honeywell expects to grow our Aerospace segment between high-single and low-double digits in 2023 as continued moderate improvement in our supply chain’s capability leads to greater output. Supply of critical mechanical components remains constrained due to skilled labor shortages among the tier 3 and 4 suppliers, but our team was able to deliver 7% output growth in 2022, including 15% output gain in 4Q22, indicative of the gathering momentum.
Within Aero, we expect robust commercial sales growth in the mid-to-high teens with particular strength in air transport, both in aftermarket and original equipment. The reopening of China (which should have a positive impact across a number of our businesses) should be a catalyst for greater international travel, a boost to widebody flight hours. For commercial OE, build rates are trending upward, allowing for increased shipset deliveries. Although Defense and Space is likely to grow low-single digits in 2023, this marks a turning point for the business thanks to firming demand throughout 2022 (book-to-bill > 1x) and improved supply of components during 2023.
With robust demand, a record backlog, and improving supply conditions, we remain confident in multi-year significant growth in Aero for both sales and margin.
Given the growth outlook, why are Aero margins expected to be flat-to-up in 2023? Is Honeywell committed to its long-term Aero segment margin target of 29%?
We have delivered steady improvement in margins over the past decade-plus and see a clear path to reach our Aero segment margin target of 29% while investing for the future. Given some of the challenges the commercial OEMs have faced delivering planes in the past few years, we expect a transitory imbalance between the cadence of new unit deliveries by the OEMs relative to our shipsets, which also means a corresponding mismatch between timing of selection credits and our OE sales volumes. This will lead to near-term headwinds to Aero margins, with the ultimate timing dependent on the cadence of OEM deliveries. However, the volume leverage we expect in 2023 combined with strong aftermarket sales can more than offset the headwind. We expect Aero margins to increase modestly over 2022.
HBT deceleration in guidance looks worse than some comparable companies in the non-resi construction market, what is the disconnect?
Honeywell Building Technologies was our fastest growing SBG in 2022 (+14% organic v. 2021), despite significant supply chain constraints related to shortages of critical semiconductor chips, demonstrating the differentiation of our technology and the value customers place on our solutions. Order rates spiked for HBT in 1H22 at the peak of supply shortages and customers offered much greater visibility for demand than historical levels. As the supply challenges have eased (HBT improved its organic volume every quarter in 2022), customer demand patterns are normalizing as well.
For 2023, we expect more balance between volume and price as supply normalizes further. Compared to peer companies in the non-resi market we have less project mix, which is favorable to our profitability, but offers less long-cycle mix when demand for product sales slows. We continue to see strong demand in several markets, particularly in high growth regions, where sustainability demand is outstripping that of developed ones. Through-cycle, we remain committed to our targets of mid-single to high-single digit organic sales growth and segment profit margin of 25%.
PMT guidance implies a slight slowdown YoY, isn’t the U.S. Inflation Reduction Act a tailwind for PMT?
Our initial guidance for PMT’s 2023 organic sales is mid-single digit growth v. 2022, which is consistent with our first cut at guidance for PMT last year. While PMT was able to ultimately deliver 11% organic sales last year, we don’t expect the environment to be as conducive to price in 2023, leading to greater balance between volume and price. We expect organic sales growth and margin expansion in each of our three strategic business units (SBUs) within PMT compared to 2022.
We believe the government incentives embedded in the U.S. Inflation Reduction Act (IRA) will be a significant boost to several parts of the Honeywell portfolio, not least our Sustainable Technology Solutions unit. The path from legislation to project awards and eventually sales for Honeywell is often multi-year, but while the impact of the IRA is limited in our 2023 guidance, we have reached several important milestones including customer wins and partnerships in carbon capture (XOM to deploy HON carbon capture technology; Johnson Matthey and HON partnership) and new product introductions in renewable fuels (HON ethanol-to-jet fuel technology). We believe continued investments to sustain hydrocarbon supply will offer growth through least the early part of the next decade, by which time our sustainable technology solutions offerings will be a multi-billion-dollar business.
As we approach the middle part of the decade, incremental legislation such as the IRA incentivizing decarbonization only further underscores our growth targets for PMT laid out at our March 2022 Investor Day: mid-single to high-single digit organic sales growth and 25% segment profit margin.
SPS sales are expected to decline again in 2023, yet you’ve guided for the segment to have the largest margin expansion of the group: what is driving this shift and what are the implications for segment profit?
Our Safety and Productivity Solutions segment sales declined -9% organically in 2022, led by weakness in our long-cycle warehouse automation (Intelligrated) business (and a sharp decrease in demand for COVID-19 masks in our Safety unit). These lost sales were partially offset by growth in our businesses such as Productivity Solutions and Services and Sensing, both accretive to overall SPS margins, thus providing a positive mix benefit. Coupled with productivity actions taken later in 2022, SPS expanded margins by 240 bps to 15.6%.
We expect a similar dynamic in 2023, as Intelligrated install sales trough, particularly given the concentration of business with one significant customer. However, the reduction in sales is enabling substantial diversification in our customer base, allowing for an enhanced margin profile mid- to long-term. Continued strong (double-digit) growth in Intelligrated’s aftermarket business drives further positive mix for margin. We expect continued growth in Sensing and Safety Technologies, and while PSS could be impacted by short-cycle demand softness and distributor destocking in 1H23, we expect sequential improvement in the second half of 2023. Overall, SPS will benefit from a full year of 2022’s productivity actions, and we see scope for the business to generate segment profit growth despite the top line headwind. We expect SPS to once again be our greatest margin expander in 2023.
As transitory demand headwinds dissipate, we expect SPS sales growth to migrate towards the high-single digit range we outlined in last year’s investor day, and with a 20% highwater mark achieved in 4Q22, we remain confident the business can sustainably deliver targeted 18% - 20% segment margin in the long term.
How is your software business performing? How does software’s growth profile compare to the portfolio overall?
Growth across our portfolio continues to be supported by accretive results in Honeywell Connected Enterprise. In 2022, HCE sales and profit both grew by double digits, including over 20% growth in our recurring and SaaS business, an indicator of the power of a strong software franchise. Last quarter, Cyber, Sparta Systems, and Connected Buildings all grew by more than 35% year over year.
Looking ahead, we are excited to deliver new solutions to customers following the 15 new products launched at the Fall 2022 HCE Connect. The launch included the new Honeywell Forge Performance+ for Industrials, a cloud-native Asset Performance solution that brings scalable and more secure advanced asset health monitoring, predictive analytics, and process optimization to help organizations operate more efficiently. As HCE’s new product introductions accelerate, we expect its accretive growth (both top line and margin) to be sustainable going forward, further underpinning our growth algorithm.
How are you tracking to your +$25B of capital deployment target? You’ve emphasized M&A is likely to get a bigger portion of capital, how would you characterize your plans there? How do share repurchases fit into the calculation?
Honeywell deployed ~$8B in capital in 2022 across capex, dividends, M&A, and share repurchases, with over half ($4.2B) allocated to buying back our shares. Thus, we remain on track for our commitment to deploy at least $25B between 2022 - 2024. As we’ve outlined in several presentations over the past year, Honeywell is exiting a period of intense internal focus on transformation (both supply chain and digitalization). As the organizational capacity consumed by these efforts starts to recede and our confidence in our Accelerator operating model to derive value increases, we believe portfolio optimization will increasingly include a more consistent pattern of acquisitions. The external environment also appears more favorable to strategic buyers such as Honeywell for the first time in several years.
Honeywell remains focused on bolt-on acquisitions which are aligned with megatrends, technologically differentiated, and offer levers for improvement for growth and profitability. We remain agnostic across our businesses for additions. One of our most recent acquisitions, Sparta, is continuing to perform very well, growing sales over 45% in 2022, expanding margin significantly, and becoming GAAP EPS accretive in year two after being acquired.
While M&A is taking a larger portion of our organizational focus, we remain opportunistic on executing share repurchases (historically our second-best return option for capital deployment after organic investment). We maintain our commitment to reduce our share count by at least 1% annually and will remain vigilant looking for chances to accelerate our efforts.
About Honeywell
Honeywell (www.honeywell.com) delivers industry specific solutions that include aerospace products and services; control technologies for buildings and industry; and performance materials globally. Our technologies help everything from aircraft, buildings, manufacturing plants, supply chains, and workers become more connected to make our world smarter, safer, and more sustainable. For more news and information on Honeywell, please visit www.honeywell.com/newsroom.
Honeywell uses our Investor Relations website, www.honeywell.com/investor, as a means of disclosing information which may be of interest or material to our investors and for complying with disclosure obligations under Regulation FD. Accordingly, investors should monitor our Investor Relations website, in addition to following our press releases, SEC filings, public conference calls, webcasts, and social media.
Forward Looking Statements
This publication contains certain statements that may be deemed “forward-looking statements” within the meaning of Section 21E of the Securities Exchange Act of 1934. All statements, other than statements of historical fact, that address activities, events or developments that we or our management intends, expects, projects, believes or anticipates will or may occur in the future are forward looking statements. Such statements are based upon certain assumptions and assessments made by our management in light of their experience and their perception of historical trends, current economic and industry conditions, expected future developments and other factors they believe to be appropriate. The forward-looking statements included in this publication are also subject to a number of material risks and uncertainties, including but not limited to economic, competitive, governmental, technological, or impacts of the Russia-Ukraine conflict affecting our operations, markets, products, services and prices. Such forward-looking statements are not guarantees of future performance, and actual results, and other developments, including the potential impact of the Russia-Ukraine conflict, and business decisions may differ from those envisaged by such forward-looking statements. Any forward-looking plans described herein are not final and may be modified or abandoned at any time. We identify the principal risks and uncertainties that affect or performance in our Form 10-K and other filings with the Securities and Exchange Commission.
Non-GAAP Financial Measures
This publication contains financial measures presented on a non-GAAP basis. Honeywell’s non-GAAP financial measures used in this publication are as follows:
- Segment profit, on an overall Honeywell basis;
- Segment profit margin, on an overall Honeywell basis;
- Expansion in segment profit margin percentage;
- Organic sales growth;
- Free cash flow;
- Free cash flow excluding impact of settlements;
- Adjusted earnings per share; and
- Adjusted earnings per share excluding pension headwind.
Management believes that, when considered together with reported amounts, these measures are useful to investors and management in understanding our ongoing operations and in the analysis of ongoing operating trends. These metrics should be considered in addition to, and not as replacements for, the most comparable GAAP measure. Certain metrics presented on a non-GAAP basis represent the impact of adjusting items net of tax. The tax-effect for adjusting items is determined individually and on a case-by-case basis. Included below are reconciliations of non-GAAP financial measures to the most directly comparable GAAP measures. Other companies may calculate these non-GAAP measures differently, limiting the usefulness of these measures for comparative purposes.
Management does not consider these non-GAAP measures in isolation or as an alternative to financial measures determined in accordance with GAAP. The principal limitations of these non-GAAP financial measures are that they exclude significant expenses and income that are required by GAAP to be recognized in the consolidated financial statements. In addition, they are subject to inherent limitations as they reflect the exercise of judgments by management about which expenses and income are excluded or included in determining these non-GAAP financial measures. Investors are urged to review the reconciliation of the non-GAAP financial measures to the comparable GAAP financial measures and not to rely on any single financial measure to evaluate Honeywell’s business.
Reconciliation of Operating Income to Segment Profit and Calculation of Segment Profit and Operating Income Margins
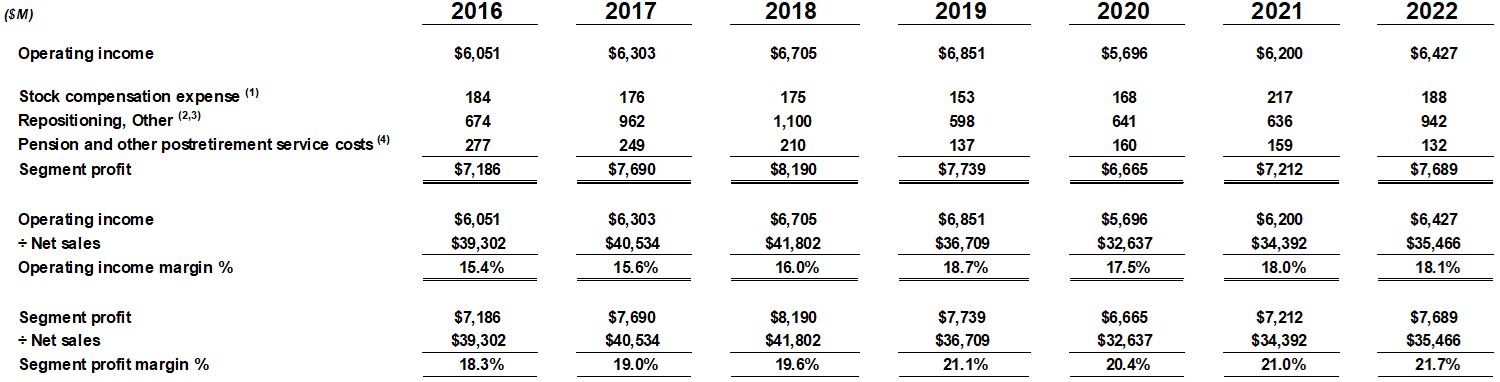
(1) Included in Selling, general and administrative expenses.
(2) Includes repositioning, asbestos, environmental expenses, equity income adjustment, and other charges. For the twelve months ended December 31, 2022, other charges include an expense of $250 million related to reserves against outstanding accounts receivables, contract assets, and inventory, as well as the write-down of other assets and employee severance related to the initial suspension and wind down of our businesses and operations in Russia. For the twelve months ended December 31, 2022 and 2021, other charges include $41 million and $105 million, respectively, of incremental long-term contract labor cost inefficiencies due to severe supply chain disruptions (attributable to the COVID-19 pandemic) relating to the warehouse automation business within the Safety and Productivity Solutions segment. These costs include incurred amounts and provisions for anticipated losses recognized when total estimated costs at completion for certain of the business’ long-term contracts exceeded total estimated revenue. These certain costs represent unproductive labor costs due to unexpected supplier delays and the resulting downstream installation issues, demobilization and remobilization of contract workers, and resolution of contractor disputes.
(3) Included in Cost of products and services sold, Selling, general and administrative expenses, and Other income/expense.
(4) Included in Cost of products and services sold and Selling, general and administrative expenses.
We define segment profit, on an overall Honeywell basis, as operating income, excluding stock compensation expense, pension and other postretirement service costs, and repositioning and other charges. We define segment profit margin, on an overall Honeywell basis, as segment profit divided by net sales. We believe these measures are useful to investors and management in understanding our ongoing operations and in analysis of ongoing operating trends.
A quantitative reconciliation of segment profit, on an overall Honeywell basis, to operating income has not been provided for all forward-looking measures of segment profit margin, segment margin, and expansion in segment profit margin expansion included herein. Management cannot reliably predict or estimate, without unreasonable effort, the impact and timing on future operating results arising from items excluded from segment profit, particularly pension mark-to-market expense as it is dependent on macroeconomic factors, such as interest rates and the return generated on invested pension plan assets. The information that is unavailable to provide a quantitative reconciliation could have a significant impact on our reported financial results. To the extent quantitative information becomes available without unreasonable effort in the future, and closer to the period to which the forward-looking measures pertain, a reconciliation of segment profit to operating income will be included within future filings.
Reconciliation of Honeywell Organic Sales % Change

Reconciliation of Reportable Business Segments Organic Sales % Change
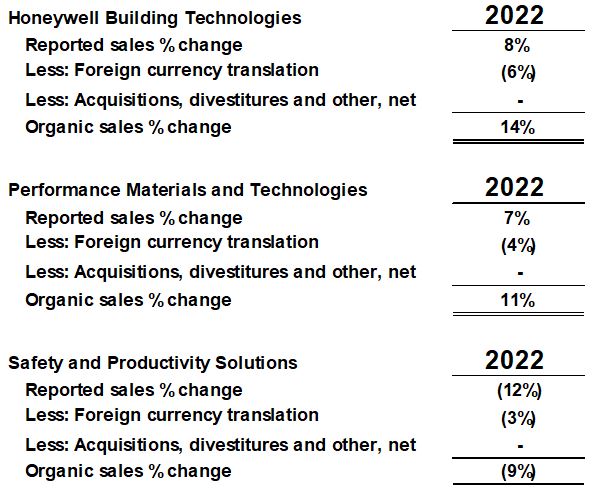
We define organic sales percentage as the year-over-year change in reported sales relative to the comparable period, excluding the impact on sales from foreign currency translation and acquisitions, net of divestitures, for the first 12 months following the transaction date. We believe these measures are useful to investors and management in understanding our ongoing operations and in analysis of ongoing operating trends.
A quantitative reconciliation of reported sales percent change to organic sales percent change has not been provided for forward-looking measures of organic sales percent change because management cannot reliably predict or estimate, without unreasonable effort, the fluctuations in global currency markets that impact foreign currency translation, nor is it reasonable for management to predict the timing, occurrence and impact of acquisition and divestiture transactions, all of which could significantly impact our reported sales percent change.
Reconciliation of EPS to Adjusted EPS and Adjusted EPS Excluding Pension Headwind
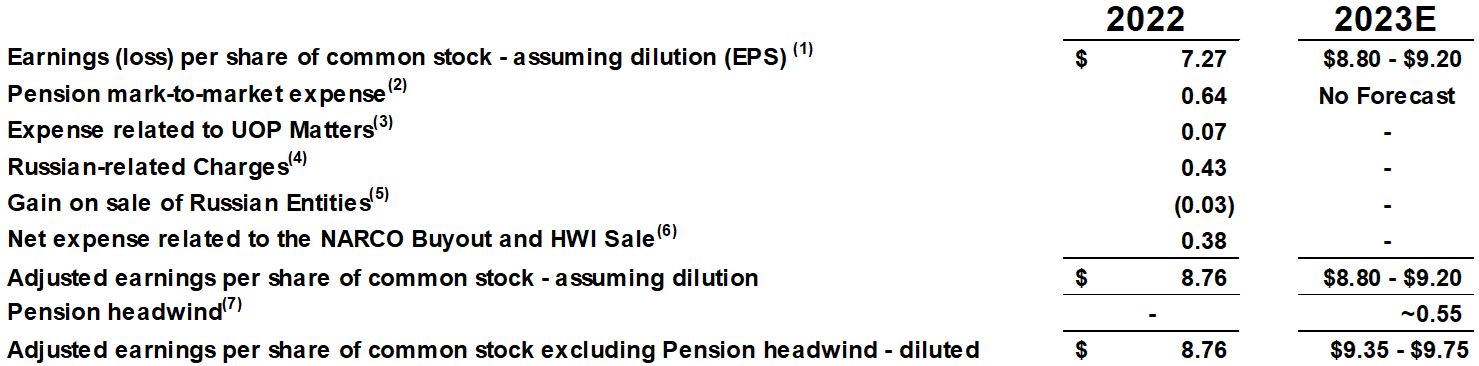
(1) For the twelve months ended December 31, 2022, adjusted earnings per share utilizes weighted average shares of approximately 683.1 million. For the twelve months ended December 31, 2023, expected earnings per share utilizes weighted average shares of approximately 672 million.
(2) Pension mark-to-market expense uses a blended tax rate of 16%, net of tax expense of $83 million, in 2022.
(3) For the twelve months ended December 31, 2022, the adjustment was an expense of $45 million, without tax benefit, due to an expense related to UOP matters.
(4) For the twelve months ended December 31, 2022, the adjustment was $297 million, including a tax valuation allowance benefit of $2 million, to exclude charges and the accrual of reserves related to outstanding accounts receivable and contract assets, impairment of intangible assets, foreign exchange revaluation, inventory reserves, the write-down of other assets, impairment of property, plant and equipment, employee severance, and called guarantees related to the initial suspension and wind down of our businesses and operations in Russia.
(5) For the twelve months ended December 31, 2022, the adjustment was $22 million, without tax benefit, due to the gain on sale of a Russian entities.
(6) For the twelve months ended December 31, 2022, the adjustment was $260 million, net of tax expense of $82 million, due to the net expense related to the NARCO Buyout and HWI Sale.
(7) For the twelve months ended December 31, 2023, the adjustments are the forecasted decline of approximately $375 million of pension ongoing income between the comparable period of 2022 and 2023, net of estimated tax expense of approximately $105 million.
We define adjusted earnings per share as diluted earnings per share adjusted to exclude various charges as listed above. We define adjusted earnings per share excluding pension headwind as adjusted earnings per share adjusted for a forecasted decline of pension ongoing income between 2022 and 2023. We believe adjusted earnings per share and adjusted earnings per share excluding pension headwind are measures that are useful to investors and management in understanding our ongoing operations and in analysis of ongoing operating trends. For forward looking information, management cannot reliably predict or estimate, without unreasonable effort, the pension mark-to-market expense as it is dependent on macroeconomic factors, such as interest rates and the return generated on invested pension plan assets. We therefore do not include an estimate for the pension mark-to-market expense. Based on economic and industry conditions, future developments, and other relevant factors, these assumptions are subject to change.
Reconciliation of Cash Provided by Operating Activities to Free Cash Flow and Free Cash Flow to Free Cash Flow Excluding Impact of Settlements
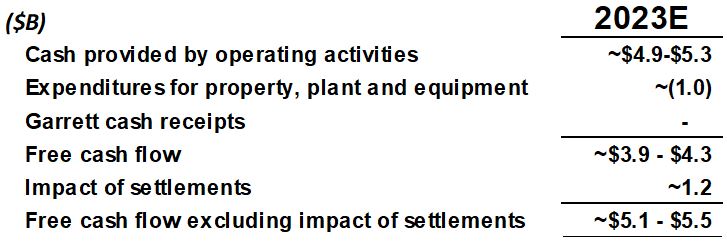
We define free cash flow as cash provided by operating activities less cash expenditures for property, plant and equipment plus anticipated cash receipts from Garrett. We define free cash flow excluding impact of settlements as free cash flow less settlements related to the NARCO Buyout, HWI Sale, and UOP Matters.
We believe that free cash flow and free cash flow excluding impact of settlements are non-GAAP metrics that are useful to investors and management as a measure of cash generated by operations that will be used to repay scheduled debt maturities and can be used to invest in future growth through new business development activities or acquisitions, pay dividends, repurchase stock, or repay debt obligations prior to their maturities. These metrics can also be used to evaluate our ability to generate cash flow from operations and the impact that this cash flow has on our liquidity.